
Distributed Tracing Basics: Traces, Spans, and Sampling
Distributed Tracing Basics: Traces, Spans, and Sampling

Distributed tracing follows a single request as it moves through every service, queue and database it touches, and records how long each hop took. Logs tell you what one service did and metrics tell you that something is off. A trace shows where in the request path the time or the failure actually lives. This guide covers what a trace is, how context travels between services, how to instrument, how to sample, and how to roll tracing out without drowning in data.
TL;DR
- Problem: In a system of many services, one slow or failed request crosses many process and network boundaries, and no single log or metric shows the whole path.
- Takeaway: A trace is a tree of spans that share one trace ID. Context propagation passes that ID between services, and instrumentation emits the spans.
- Cost control: Tracing every request adds measurable overhead at high volume. Sampling keeps the useful traces and drops the bulk.
- Next step: Instrument one critical request path with OpenTelemetry, keep every error and slow trace, and tie traces to the rest of your operational context so investigations do not stop at the trace view.
Table of Contents
- What distributed tracing is and the problem it solves
- Traces, spans and attributes
- How a trace follows a request across services
- How teams instrument services
- Sampling: deciding which traces to keep
- What tracing costs in production
- When tracing earns its keep
- How traces fit with logs and metrics
- Security: what trace headers can leak
- Connecting traces to the rest of the investigation
- A rollout checklist for a small team
- Common mistakes
- FAQ
- Sources
What distributed tracing is and the problem it solves
A monolith runs a request inside one process. A stack trace or a profiler shows the whole story. A microservice or serverless architecture splits that same request across many services, often written in different languages and owned by different teams. When checkout takes six seconds, the slow part could be the API gateway, a downstream service, a cache miss or a database query.
OpenTelemetry’s observability primer says distributed tracing lets you observe requests as they propagate through complex, distributed systems. It also says tracing is essential for systems whose problems are nondeterministic or too complicated to reproduce locally, and that without it, finding the root cause of performance problems can be challenging.
That is the whole value proposition. Tracing replaces guesswork about which service to open first with a recorded path for a specific request.
Traces, spans and attributes
Three terms carry most of the topic.
Trace. The primer defines a distributed trace as the path a single request takes as it moves through multiple services. It is made of one or more spans.
Span. A span is one unit of work inside that request: an HTTP handler, a database query, a call to another service. Each span records a name, a start time, a duration and a parent. The first span, called the root span, represents the request from start to finish.

Attributes. Key-value pairs attached to a span, such as the HTTP route, the status code, the database statement type or the deployment version. Attributes are what let you filter thousands of traces down to the ones that matter.
A simplified trace for a checkout request looks like this:
| Span | Service | Parent | Duration |
|---|---|---|---|
| POST /checkout | api-gateway | none (root) | 2,340 ms |
| createOrder | orders | POST /checkout | 2,210 ms |
| reserveStock | inventory | createOrder | 180 ms |
| chargeCard | payments | createOrder | 1,950 ms |
| SELECT customer | payments-db | chargeCard | 1,880 ms |
The numbers are illustrative, but the reading is real. The gateway and orders spans are long only because they wait on payments, and payments is long because one database query is. A trace view draws this as a waterfall, and the culprit is the widest bar at the deepest level.
How a trace follows a request across services
Spans in different services only join into one trace if they share an identifier. That is the job of context propagation.
Per OpenTelemetry’s context propagation documentation, when Service A calls Service B, A includes a trace ID and span ID in the context. B uses those values to create a new span in the same trace and sets A’s span as its parent. Repeat that at every hop and the full flow of the request can be reconstructed from independently emitted spans.
Two details matter in practice:
- Propagation is usually invisible. The context is serialized into the outgoing request and deserialized on arrival, and instrumentation libraries normally do this for you.
- There is a default format. The default propagator uses W3C TraceContext headers, so services instrumented by different teams can still join the same trace.
The common failure is a broken chain. A service that does not forward the headers, a message queue that drops them, or an async job that starts a fresh trace all produce orphaned spans. If your traces stop at one service boundary, check propagation there first.
How teams instrument services
Instrumentation is the code that emits spans. OpenTelemetry’s instrumentation documentation describes two primary approaches, and you can use both at once:
- Code-based instrumentation. You use the official APIs and SDKs, available for most languages. This gives deeper insight and rich telemetry from the application itself, such as a span around a business operation like applying a discount.
- Zero-code instrumentation. An agent or auto-instrumentation layer produces telemetry from libraries and the runtime environment, such as inbound HTTP, outbound HTTP and database clients, without touching application code.
A practical order for a small team is to start with zero-code coverage so every service appears in the trace, then add manual spans where the automatic ones are too coarse. Context propagation is built into the implementations, and semantic conventions standardize naming across platforms, so an HTTP span from a Java service and one from a Go service use the same attribute names. Consistent naming is what makes cross-service queries possible later. For a worked look at applying shared conventions in a specific setting, see this example of OpenTelemetry traces from an LLM gateway.
Spans are then exported, commonly through an OpenTelemetry Collector, to whatever backend stores and visualizes them. Keeping the Collector between your services and the backend lets you change sampling and routing without redeploying applications.
Sampling: deciding which traces to keep
Tracing every request is rarely affordable at scale. Sampling keeps a subset. There are two classic strategies, and a trade-off between them.
Head sampling decides at the start of the trace, at the root span, using only what is known then. The decision travels downstream with the request, so every service agrees on whether the trace is kept. It is cheap and simple. Its weakness is that it decides before it knows whether the request will fail or be slow.

Tail sampling decides after the trace is complete, so it can keep every error and every slow request and sample the healthy ones lightly. It needs a component that buffers whole traces, which adds collection and ingestion overhead and operational complexity. Research on the problem puts it this way: head-based sampling may miss critical events, while tail-based sampling incurs collection and ingestion overheads.
A quick illustration of why the choice matters. Suppose a service fails 200 requests a day. A flat 10% head rate surfaces about 20 of those failures as traces. A 1% rate surfaces about 2. A tail policy that keeps all errors surfaces all 200 while still sampling successful requests at 1%.
| Approach | Decides | Keeps errors reliably | Overhead | Good fit |
|---|---|---|---|---|
| Head, probabilistic | At the root span | No | Lowest | Small systems, tight budgets |
| Tail, policy-based | After the trace completes | Yes | Needs buffering and a Collector tier | Teams that investigate incidents from traces |
| Combined | Both | Yes | Moderate | Most production setups |
A common production pattern is to capture whole traces at the edge, then apply outcome-based keep-or-drop rules in the Collector: keep errors, keep requests above a latency threshold, sample the rest.
What tracing costs in production
Instrumentation is not free, so it helps to know the order of magnitude. An article summarizing Google’s published tracing research reports that creating and finishing a root span averaged 204 nanoseconds, and a non-root span 176 nanoseconds on a 2.2 GHz x86 server. The same article reports Google’s production measurements: at full sampling, average latency rose 16.3% and throughput fell 1.48%. At 1/16 sampling the latency change was 2.12%, and at 1/1024 it was within measurement error.
Two lessons follow. Per-span cost is small, and the bulk of the overhead comes from volume and export. And sampling is the control that brings overhead down. Those figures come from one large-scale system, so treat them as a guide to the shape of the curve and measure your own services after rollout.
When tracing earns its keep
Tracing is most useful for a specific set of questions:
- Where is the latency? A p99 latency alert tells you something is slow. A trace of a slow request shows which span consumed the time.
- Which dependency is failing? An error in the gateway often originates three services down. Parent-child links lead you to the first span that failed.
- Is the slowness serial or parallel? The waterfall shows calls that run one after another and could be concurrent.
- What changed for this request? Attributes such as version, region or feature flag let you compare a slow trace to a healthy one.
- Which services are really connected? Traces reveal actual call paths, including dependencies nobody documented.
It is a weaker tool for questions about aggregate trends, such as error rate over a week. Metrics answer those better and cheaper. Tracing is for the individual request, and the three signals work together.
How traces fit with logs and metrics
Metrics tell you something changed. Traces tell you where along a request path. Logs tell you what the code said while it was there. The value comes from joining them.
OpenTelemetry’s documentation notes that SDKs can automatically correlate logs with traces, so each log line appears in the context of the trace and span it belongs to, even across service boundaries. In practice, that means a trace ID in your logs. When a trace points at the payments database span, you search logs by that ID and read the exact error.
For an incident, the sequence is usually: an alert fires from a metric, a trace of an affected request narrows the service and span, then logs and recent changes explain why. Each step sits in a different tool, which is where investigations slow down.
Security: what trace headers can leak
Propagation crosses trust boundaries, and that has consequences. OpenTelemetry’s guidance warns that incoming context from untrusted sources may contain forged trace headers that manipulate tracing data or exploit parsing vulnerabilities. Outgoing context can leak internal trace IDs, span IDs or baggage items that reveal internal architecture or business logic.
Safe defaults:
- At your public edge, do not blindly trust inbound trace headers. Start a new trace or validate the context.
- Strip or limit propagation headers on calls to external third-party services.
- Keep baggage free of customer identifiers and secrets.
- Avoid putting sensitive values in span attributes, such as full query parameters or tokens.
Connecting traces to the rest of the investigation
A trace answers which span was slow. During an incident you also need to know what deployed, which pods restarted, what the cloud provider reported and whether this happened before. That evidence lives in separate tools, so the trace is one input to a larger investigation rather than the investigation itself.
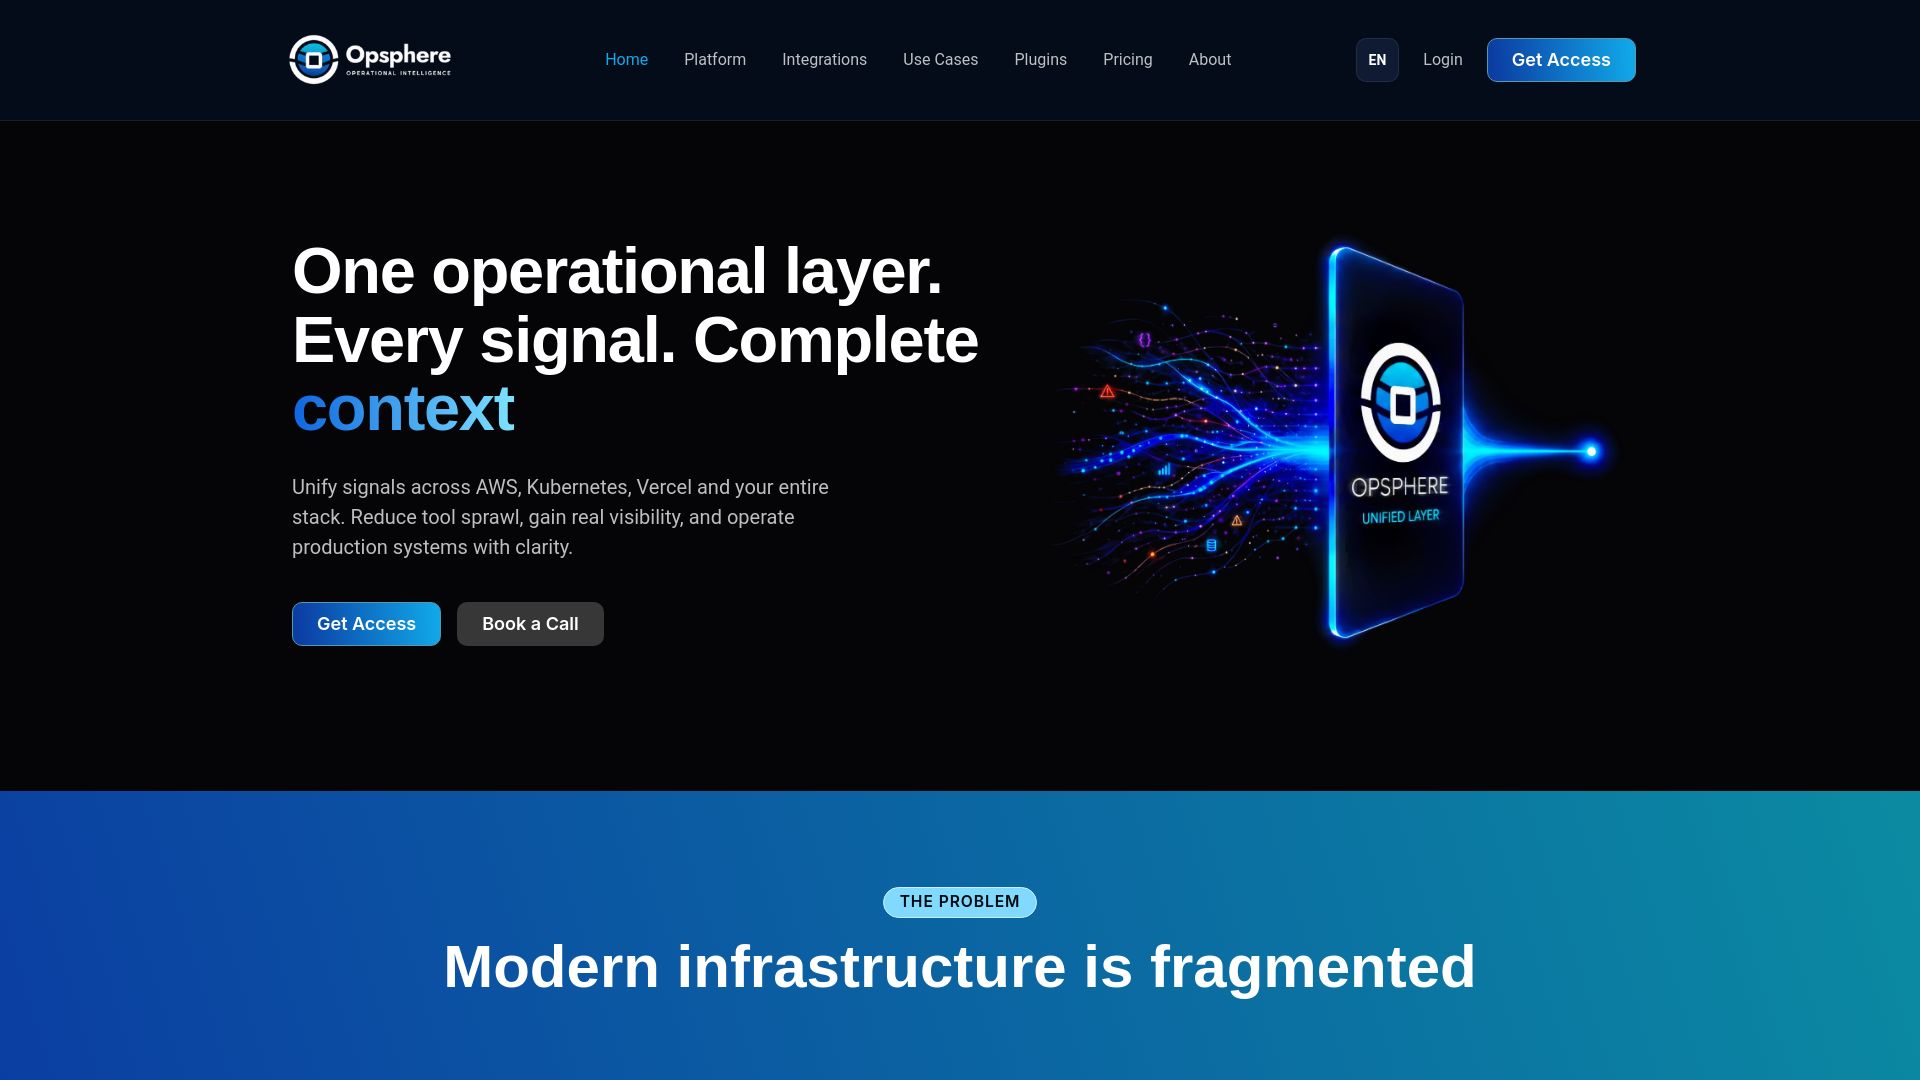
Opsphere is an operational intelligence platform that unifies operational context across AWS, Kubernetes, observability, CI/CD, security and engineering tools in a single interface. It connects to the tools you already run without requiring you to replace them, and its more than 300 operational tools are read-only. Teams can run evidence-backed investigations that pull from those sources, and keep what they learn in operational context and investigation memory, so the next incident starts with what the last one established. Teams that already follow Kubernetes monitoring practices will recognize the pattern: signals are only as useful as the context around them.
For teams adopting AI agents and Model Context Protocol (MCP, an open standard that lets AI tools call external systems), the MCP operational gateway gives agents read-only access to that operational data. Plans start at 0 € per month on Community, with Developer at 19 € per month and Team at 500 € per month, as listed on the pricing page.
A rollout checklist for a small team
You do not need full coverage on day one. This sequence works for a small SRE team.
- Pick one critical request path. Checkout, login or the main API call. Trace that end to end first.
- Turn on zero-code instrumentation for the services on that path, then confirm all of them show up in one trace.
- Verify propagation across async hops. Queues, schedulers and background jobs are where traces most often break.
- Standardize attribute names using semantic conventions, and add service name, version and environment to every span.
- Put a Collector in the path. It gives you one place to change sampling, filtering and export.
- Start with simple sampling, then move toward keeping errors and slow traces. Review the policy after your first real incident.
- Put the trace ID in your logs. This single change makes traces and logs navigable together.
- Review the data for sensitive values before you widen coverage.
- Write down what a trace answered. Capture it in a runbook or investigation notes so it is reusable.
Common mistakes
- Instrumenting everything before anyone reads a trace. Coverage without a question to answer produces cost, not insight.
- High-cardinality attributes on every span. User IDs and request IDs as attributes inflate storage and slow queries. Use them selectively.
- Sampling too low too early. At 1% head sampling, rare failures are mostly invisible.
- Ignoring the edge. If the first hop does not start the trace correctly, everything downstream is fragmented.
- Treating the trace backend as the only source of truth. Traces show request flow. Deploys, infrastructure state and configuration live elsewhere.
FAQ
What is distributed tracing in simple terms?
It is a record of one request’s journey through all the services that handled it. Each step is a span, and all spans in the journey share a trace ID. You read the result as a timeline showing where time was spent and where errors occurred.
What is the difference between a trace and a span?
A span is one operation, such as a database query or an HTTP call. A trace is the full collection of spans for one request, linked by parent-child relationships. The first span is the root span and represents the request from start to finish.
Do I need OpenTelemetry for distributed tracing?
Not strictly, but it is the common vendor-neutral standard. It provides APIs, SDKs, zero-code instrumentation, semantic conventions and W3C TraceContext propagation by default. Using it means you can change backends without re-instrumenting your services.
How is tracing different from logging?
Logs are events from one service. Traces connect work across services and show timing and causality. When logs carry the trace ID, you can move from a slow span straight to the log lines written during it.
How much sampling should I use?
It depends on volume, budget and how often you need rare failures. A sound starting point is a low baseline rate for healthy requests, with all errors and slow requests kept through tail-based rules. Measure overhead on your own services and adjust.
Sources
- Observability primer, OpenTelemetry
- Context propagation, OpenTelemetry
- Instrumentation, OpenTelemetry
- Tracezip: Efficient Distributed Tracing via Trace Compression
- What Distributed Tracing Solves in Low Latency Systems, Aerospike
- OpenTelemetry for LLMs: Audit-Grade Traces from a Gateway
Recommended
- Golden Signals Monitoring: The Four Signals and How to Use Them
- GitHub in Production: Trace Incidents to Code Changes
- Akamai CDN: How to Investigate Edge Issues in Production
- Akamai: Trace WAF Blocks and Origin Errors Together
This article is provided for general informational purposes only and does not constitute professional, legal, security, or compliance advice. Please evaluate recommendations against your organization’s specific environment and requirements.