
Cut Local Debugging Friction: VS Code Observability in 4 Steps
Cut Local Debugging Friction: VS Code Observability in 4 Steps
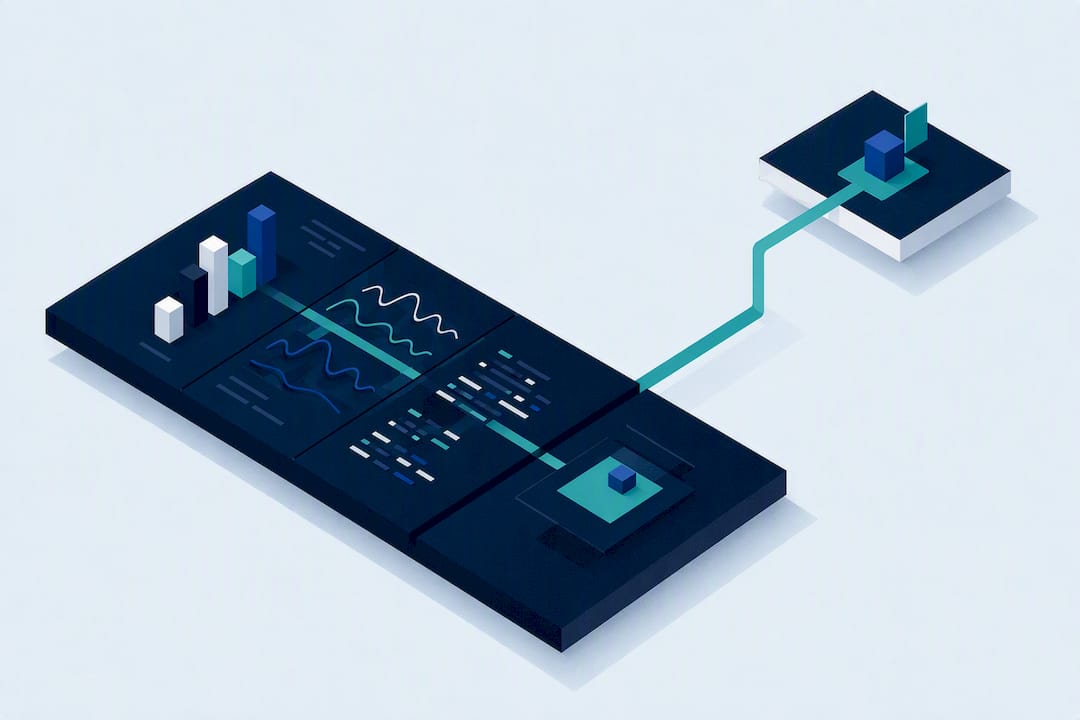
VS Code can surface metrics, traces, logs, and agent runs without leaving the editor, once you enable OpenTelemetry export and point it at a local collector or viewer. The fastest path: turn on OTLP export in settings or environment variables, install a metrics or trace extension that matches your stack, and run a lightweight local collector like Jaeger. That single change cuts the number of tabs you juggle while debugging a chain of local microservices, turning “which service broke” into a question you can answer inside the editor.
TL;DR:
- Enabling OTLP export and pointing it to a local collector like Jaeger allows trace data to appear in VS Code within seconds during local debugging.
- The choice of extensions for observability depends on specific needs, such as resource monitors for system load, trace viewers for request paths, or log streaming for error analysis.
- Proper propagation of trace headers and correct collector configuration are essential to ensure distributed traces are coherent across multiple local services.
- Reducing telemetry refresh intervals below 500 milliseconds or disabling unnecessary monitors can prevent editor slowdown during intensive debugging sessions.
- For complex, cross-cluster incidents, integrating VS Code telemetry with a dedicated platform like Opsphere provides broader context and automatic correlation across environments.
Table of Contents
- What Does VS Code Observability Actually Surface?
- How Do You Enable OpenTelemetry in VS Code?
- How Does VS Code Debugging Support Observability Workflows?
- Making Distributed Traces Useful Across Local Services
- Keeping IDE Observability Fast Enough to Actually Use
- When to Add an Operational Intelligence Layer
- Setting Up VS Code for Multiple Microservices at Once
- Automating Observability Startup With VS Code Tasks
- Viewing Observability Data Without Leaving the Editor
- Fixing Common VS Code Observability Problems
- Security Considerations for Local Observability Setups
- Bringing Enterprise Correlation to Your Editor Workflow
- Sources
- FAQ
What Does VS Code Observability Actually Surface?
VS Code observability isn’t one feature. It’s a category of extensions and built-in capabilities that each expose a different slice of telemetry, and picking the right one depends on what you’re debugging.
Resource monitors handle the system-level view: CPU, memory, network, and GPU usage inside the editor. Extensions like Vitals integrate directly with Prometheus, Jaeger, and Datadog backends, so you can watch a Dev Container or WSL environment strain under load without switching to a terminal.
Trace viewers cover distributed request paths. If your services emit OpenTelemetry spans, an OTel-compatible viewer lets you click through a trace the same way you’d step through a debugger, jumping from one span to its children.
Log streaming extensions handle the third leg: real-time tailing with syntax highlighting and filters, so you’re not gripping a scrollback buffer during an incident replay.
Agent and LLM observability is newer but growing fast, with enterprise AI and engineering services helping teams operationalize observability at scale. Copilot Chat and similar in-editor agents can emit spans for individual runs, tool calls, and token usage, which matters if you’re debugging a service that calls an LLM as part of its request path.
Matching extension type to need looks like this:
- System strain during load testing: a Vitals-style resource dashboard
- Request failing three services deep: an OpenTelemetry trace viewer
- Chasing an intermittent error message: a log-streaming extension with filter support
- Debugging an agent’s tool-call chain: agent-monitoring integrations built on OTel spans
How Do You Enable OpenTelemetry in VS Code?
Getting traces flowing into the editor takes four steps, and most of the friction is in getting the export destination right, not the VS Code side.
- Enable OTel export. Settings like
github.copilot.chat.otel.enabledor environment variables such asCOPILOT_OTEL_ENABLEDandOTEL_EXPORTER_OTLP_ENDPOINTcontrol whether an agent or extension emits telemetry, and VS Code’s OpenTelemetry monitoring guide documents the precedence rules when both are set. - Point OTLP at a local endpoint. Set
OTEL_EXPORTER_OTLP_ENDPOINTtohttp://localhost:4318or wherever your collector listens, so nothing leaves your machine during local debugging. - Run a minimal collector. A single Docker command (
docker run -p 16686:16686 -p 4318:4318 jaegertracing/all-in-one) gets Jaeger running locally; Tempo or an Aspire standalone dashboard work the same way for teams already in that ecosystem. - Verify with a one-minute checklist: confirm the collector is receiving data, trigger one request through your service chain, then check that spans appear in the viewer within a few seconds.
For agent observability specifically, watch for span names like invoke_agent, chat, and execute_tool in the trace output. Their presence confirms the pipeline is wired correctly end to end, since these are the standard GenAI semantic convention span names VS Code agents emit.
How Does VS Code Debugging Support Observability Workflows?
VS Code’s debugger runs on the Debug Adapter Protocol (DAP), a standardized interface between the editor and language-specific debug adapters. That standardization is what lets the same debugging UI work across Node.js, Python, Go, and a dozen other runtimes, and it’s also why telemetry and debugging can share the same launch configuration instead of living in separate tools.
For JavaScript and TypeScript services, js-debug is the default adapter. It supports Auto Attach, so a node process launched from an integrated terminal gets debugged automatically, along with performance profiling and multi-target debugging for services that spawn child processes.
launch.json is where this gets useful for microservices work. A compound configuration can start three or four instrumented services simultaneously, each with its own environment variables (including the OTLP endpoint), so a single F5 press launches your whole local stack with telemetry already flowing.
- Use launch configurations when you need OTLP env vars set at process start.
- Use attach configurations when a service is already running (often in a container) and you just need to hook a debugger into it without restarting.
- Compound configs combine both, letting one service launch fresh while another gets attached.
Pro Tip: Name each configuration in launch.json after the service it targets (“orders-api”, “auth-service”) rather than “Launch Program”. When you’re debugging five services at once, that naming difference saves real time.
Making Distributed Traces Useful Across Local Services
A trace only tells a coherent story if every service in the chain agrees on the same request identity. Without consistent propagation, reconstructing an end-to-end path across services fails even when each service is individually instrumented.
- Propagate W3C Trace Context. Inject the
traceparentheader at your entry point and confirm every downstream service forwards it unmodified. Frameworks that don’t propagate headers automatically need a manual injection step added to service startup scripts. - Choose hook based or native instrumentation for agent spans. Hook-based pipelines emit structured lifecycle events into OTLP after the fact; native instrumentation captures them as the agent runs. Native is more accurate for token usage and tool-call timing; hooks are faster to bolt onto an existing service.
- Pick a collector topology that matches your team’s size. OTLP-to-local-Jaeger is the simplest setup for a single developer. OTLP-to-file-then-viewer works better for asynchronous debugging, where you replay a captured trace later instead of watching it live.
- Join logs, metrics, and traces by request ID inside the IDE. Filter your log viewer by the same trace ID shown in the trace viewer, and you can follow one request across three services without leaving VS Code.
Keeping IDE Observability Fast Enough to Actually Use
Telemetry inside the editor has a cost, and ignoring it turns a debugging aid into a reason your extension host hangs.
Refresh intervals matter more than most developers expect. Practitioner guidance and extension documentation both warn against tight refresh intervals for heavy metrics dashboards, since polling faster than every 500 milliseconds compounds extension host overhead fast, especially with multiple services reporting simultaneously.
- Set metrics refresh intervals above 500ms unless you’re actively chasing a spike.
- Cap attribute payload size with
maxAttributeSizeand capture selectively rather than logging full request bodies by default. - Stream spans to a collector for live debugging; persist to SQLite or export to a file only when you need to replay a session later.
- Bind a keyboard shortcut to your trace viewer so opening a trace doesn’t require three menu clicks mid-incident.
Pro Tip: Turn off resource monitor extensions when you’re not actively profiling. Constant background polling is the most common cause of a sluggish editor during long debugging sessions.
When to Add an Operational Intelligence Layer
In-IDE observability is built for one thing: fast feedback during a single debugging session on your own machine. It answers “why did this request fail on my laptop right now,” and for that job it’s the right tool.
What it doesn’t do is correlate an incident across a production cluster, deduplicate alerts firing from six different services, or generate a runbook automatically when a pattern repeats. That’s a different scope of problem, and it’s where a unified operational intelligence layer like Opsphere picks up where local traces leave off.
Opsphere ingests telemetry from multiple sources, including the same OpenTelemetry data your local setup produces, and preserves correlation across environments instead of replacing what you already have running in VS Code. The practical split: keep your in-IDE traces for day-to-day development, and bring in a platform layer once you need cross-cluster correlation, governance over who can see what, or automated context when an incident spans more than one team’s services.
Setting Up VS Code for Multiple Microservices at Once
Debugging one service in isolation is straightforward. Debugging five services that talk to each other is where most default VS Code setups fall apart, usually because each service was configured as if it were the only one running.
A multi root workspace is the starting point. Add each microservice’s folder to the same workspace file, and VS Code treats them as one project for search, debugging, and task running, while keeping their dependencies and settings separate.
From there, launch.json compound configurations do the heavy lifting. Define one launch entry per service, each with its own working directory, environment variables, and port, then group them under a single compound block so one F5 starts the whole set. This matters for observability specifically because each entry can carry its own OTEL_SERVICE_NAME, which is what lets a trace viewer tell your orders-api spans apart from your inventory-api spans instead of showing an undifferentiated blob.
Port management deserves its own line in your settings. Local microservices tend to collide on default ports, so assigning each service an explicit port in its launch configuration, and documenting it in a workspace .env.example file, avoids the common failure where two services silently fight over 3000.
For teams debugging container-based services, the Dev Containers workflow lets each microservice run in its own container while VS Code attaches a debugger to each, keeping the isolation of containers without losing the single-editor view of traces and logs across all of them.
Automating Observability Startup With VS Code Tasks
Manually starting a collector, then a viewer, then each microservice, before you can even begin debugging, wastes the first ten minutes of every session. VS Code’s tasks.json exists to eliminate exactly that friction.
A task can run your Docker collector command, wait for it to be healthy, then hand off to your compound launch configuration. Define a task with "type": "shell" that runs docker compose up -d jaeger (or your equivalent collector command), and set "isBackground": true so VS Code doesn’t block waiting for it to exit, since collectors are meant to keep running.
Chain tasks with dependsOn so a single command, run through the Command Palette or a keybinding, brings up your entire local observability stack in the right order: collector first, then services, then an automatic browser tab pointed at your trace viewer’s UI if you want one.
Workspace settings deserve the same automation treatment. Storing OTEL_EXPORTER_OTLP_ENDPOINT and other shared environment variables in a workspace .vscode/settings.json (with a .env file loaded via an extension like DotENV) means every teammate who opens the workspace gets the same telemetry configuration without a setup document to follow. That consistency matters more than it sounds: inconsistent OTLP endpoints across a team are a common reason “it works on my machine” extends to observability setups, not just code.
Viewing Observability Data Without Leaving the Editor
The value of in-IDE observability collapses the moment you have to alt-tab to a browser to actually read the data, which is why the viewer extension you choose matters as much as the telemetry pipeline feeding it.
Trace viewers built into extensions render a waterfall view directly in an editor panel, showing span duration, parent-child relationships, and attributes without leaving VS Code’s window. That waterfall is the same visual pattern Jaeger and Tempo use in their web UIs, just embedded where you’re already working.
Metrics dashboards, the kind extensions like Vitals provide, sit in a sidebar or status bar and update live, so you can watch memory climb during a load test while your cursor stays in the code that’s causing it. Some vendor extensions go further: Splunk’s Observability Studio bundles a local observer runtime that previews traces, metrics, logs, and dashboards inside the editor, which shows where this category of tooling is heading, toward full local runtimes rather than thin clients pointed at a remote backend.
Custom views built on VS Code’s Webview API let extension authors render arbitrary dashboards, which is how some teams build a single panel that overlays logs, a trace ID, and a metrics graph for one request, side by side, instead of switching between three separate extension views.
The practical workflow: keep your trace viewer and log panel open in a split view, filter both by the same trace ID after a request fails, and you’ve replaced three browser tabs and a terminal with two editor panes.
Fixing Common VS Code Observability Problems
Most integration failures come down to a handful of repeat offenders, and recognizing them saves an hour of guessing.
No traces appearing at all almost always means the OTLP endpoint is misconfigured or the collector isn’t listening yet. Confirm the collector container is actually running (docker ps) before assuming the extension is broken, and check that the port in OTEL_EXPORTER_OTLP_ENDPOINT matches what the collector exposes.
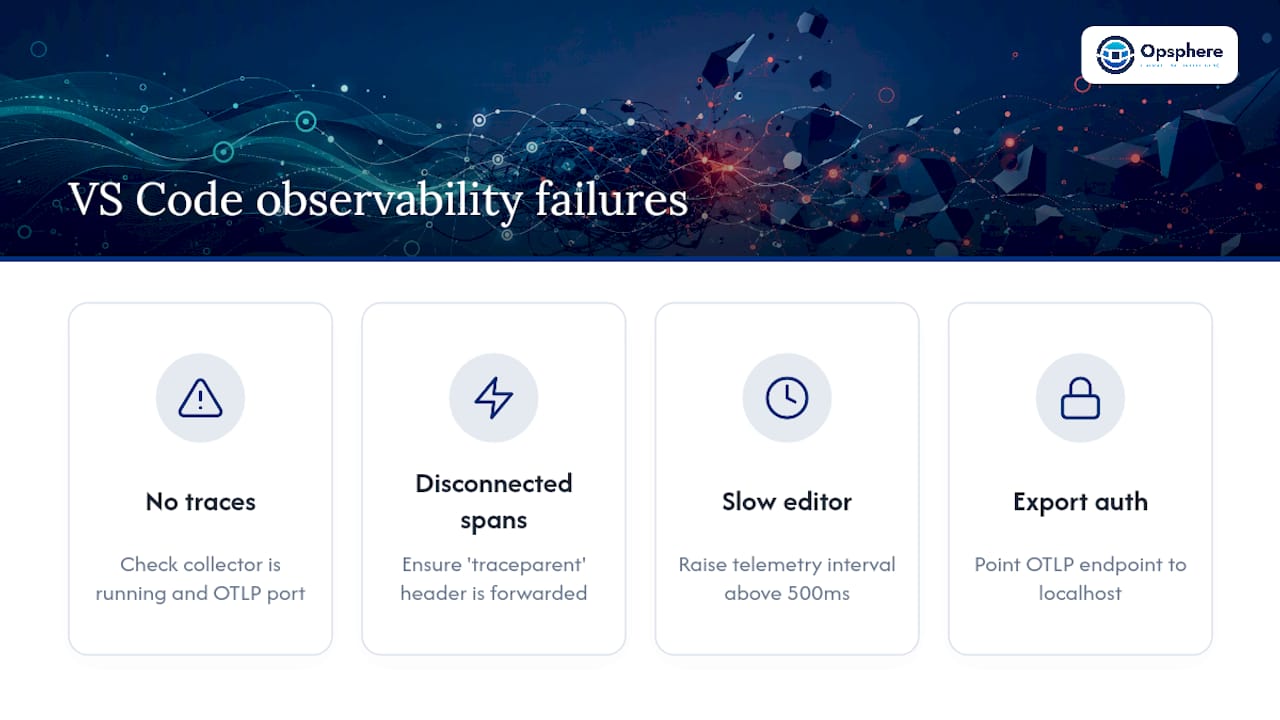
Traces appear but are disconnected (spans show up but don’t chain into one request) points to a propagation gap. One service in the chain isn’t forwarding the traceparent header, usually because a manual HTTP client call skipped the instrumentation library’s default headers.
The editor slows down noticeably once telemetry is enabled usually traces back to refresh intervals set too aggressively, or a metrics extension polling multiple containers every few hundred milliseconds. Raising the interval above 500ms and disabling monitors you’re not actively watching resolves most of this.
Extension conflicts show up when two observability extensions both try to render a status bar item or claim the same keybinding. Check the Extensions panel for slow-loading extensions using VS Code’s built in “Show Running Extensions” command, which flags which one is eating startup time or CPU.
Auth or endpoint errors on export are frequently a leftover cloud OTLP endpoint from a previous project. Double check that OTEL_EXPORTER_OTLP_ENDPOINT points at localhost during local debugging, not a remote vendor URL that requires credentials you don’t have configured locally.
Security Considerations for Local Observability Setups
Instrumenting local microservices means telemetry can capture more than you intend, and that’s worth deciding on deliberately rather than by default.
Content capture is the biggest risk. Agent and request traces can include full prompt text, response bodies, or request payloads if capture settings are permissive. Setting a maxAttributeSize and choosing conservative redaction defaults keeps sensitive fields out of spans by default, and you should only loosen that if your team’s compliance posture explicitly allows persisting that data.
Local collectors still need access controls. A Jaeger instance running on localhost:16686 with no authentication is fine for a solo developer, but on a shared development server or a machine with other users, that same open port exposes trace data, including any captured payloads, to anyone on the network.
Environment variables carrying OTLP endpoints or API keys shouldn’t live in a workspace’s committed .vscode/settings.json. Use a .env file excluded via .gitignore, or a secrets manager if your organization has one, so a collector endpoint or export credential doesn’t end up in your git history.
Finally, treat any third-party observability extension as you would a dependency with production data access. Extensions that read workspace files or intercept network calls to build their dashboards should come from verified publishers, since a compromised extension with telemetry access is a realistic path to leaking captured request data.
Bringing Enterprise Correlation to Your Editor Workflow
In-IDE observability is unbeatable for one developer chasing one bug across a handful of local services. It falls short the moment an incident spans a production cluster, a dozen services, and three different teams, none of whom are looking at the same trace viewer.
That’s the gap Opsphere is built to close. Instead of replacing the traces you’re already generating in VS Code, Opsphere’s operational intelligence layer ingests telemetry from AWS, Kubernetes, CI/CD, and observability tools alongside your existing OpenTelemetry data, correlates it across environments, and cuts through alert noise that would otherwise bury the one signal that matters. Where your local collector shows you one service’s traces, Opsphere reconstructs the operational picture across every service, cluster, and cloud account your team runs, with automated runbook generation and alert deduplication built on top of over 300 read-only tool integrations.
If your team has outgrown “check five different dashboards during an incident,” the practical next step consists of seeing how that correlation works against your own stack. Start with the Opsphere web client to explore trace waterfalls and topology views across your infrastructure, or check the platform engineering use case if you’re evaluating this for a broader team rollout.
Sources
- Vitals — Visual Studio Marketplace
- Debug code with Visual Studio Code
- Monitoring agent usage with OpenTelemetry (VS Code)
FAQ
What Are the Four Pillars of Observability?
Most practitioners define them as metrics, logs, traces, and events, sometimes with a fifth (profiles) added in newer frameworks. Inside VS Code, each pillar maps to a different extension type: metrics to resource monitors like Vitals, traces to OTel-compatible viewers, and logs to streaming extensions with filtering.
Is VS Code Trustworthy for Handling Sensitive Telemetry Data?
VS Code itself is a widely used, actively maintained editor, but trust for telemetry specifically depends on your extension choices and settings. Setting a conservative maxAttributeSize and redaction defaults, and vetting any third-party observability extension before granting it workspace access, are the practical controls that matter most.
What Is Telemetry in Code?
Telemetry in code refers to the metrics, traces, logs, and events an application emits about its own behavior and performance, typically exported via a standard like OpenTelemetry. In a VS Code context, that telemetry gets captured locally and surfaced through extensions or viewers instead of being sent to a remote backend.
Which Is Better, Code OSS or VSCodium?
Code OSS is Microsoft’s open-source build of VS Code without telemetry collection or proprietary branding baked in, while VSCodium is a community-maintained distribution of that same source with telemetry stripped and Microsoft’s marketplace replaced by Open VSX. For observability work specifically, the choice matters less than which extensions you can access, since some vendor observability extensions are Marketplace-only and won’t install on VSCodium without extra configuration.
How Do I Start Seeing Traces in VS Code Right Now?
Enable OTLP export through your agent’s settings or environment variables, point OTEL_EXPORTER_OTLP_ENDPOINT at a local collector like Jaeger running in Docker, then trigger a request and check the collector’s UI for spans within seconds. From there, an OTel-compatible trace viewer extension brings that same data into the editor itself.
Recommended
This article is provided for general informational purposes only and does not constitute professional, legal, security, or compliance advice. Please evaluate recommendations against your organization’s specific environment and requirements.