
Pilot One Service: Dashboard Free Observability for SREs
Pilot One Service: Dashboard Free Observability for SREs

Skip the dashboard as your default answer. Favor agent-driven reflex arcs and narrative observability, backed by headless data access, over dashboard-first workflows. You get faster reaction, lower ingest cost, and clearer incident narratives. Pilot one service this quarter with a reflex path running in parallel with your existing dashboard before you retire anything.
TL;DR:
- Most teams should pilot reflex paths alongside existing dashboards for two to four weeks to compare mean time to resolution and diagnosis.
- Headless observability stores telemetry in open formats and exposes it via APIs, enabling script and CLI access without vendor lock-in.
- Automated remediation should target the most common failure modes first, using proven pattern history to avoid causing incidents.
- The platform Opsphere provides a unified, API-driven investigation layer that integrates with existing tools and supports headless, narrative, and reflex architecture patterns.
- Validation before full rollout involves assessing decision latency, false positive rates, and rollback plans for reflex rules, ensuring safety before automating sensitive actions.
Table of Contents
- What Does Observability Without Dashboards Actually Mean?
- How Do You Design a Reliable Reflex Arc?
- What Architecture Patterns Should You Pilot First?
- How Do You Decide What to Retire, Keep, or Rearchitect?
- How Does Opsphere Fit a Post-Dashboard Strategy?
- Can Alerting and Remediation Tools Replace Dashboards?
- Piloting a Dashboard-Free Workflow With Opsphere
- Sources
- FAQ
What Does Observability Without Dashboards Actually Mean?
Observability without dashboards doesn’t mean flying blind. It means the primary path to detection and decision runs through structured events, programmatic queries, and automated reaction, with dashboards demoted to a reporting tool instead of the front line of incident response. The distinction matters because dashboards are built to answer questions engineers already thought to ask. They visualize known failure modes well and novel ones poorly, which is exactly when incident response needs them most, as one widely cited analysis of observability design points out.
Four approaches make up the alternative taxonomy, and most mature teams end up running two or three of them at once.
- Headless observability stores telemetry in open, queryable formats and exposes it through APIs rather than a proprietary UI, which solves vendor lock-in and lets scripts, agents, and CLI tools read the same data a dashboard would show, as described in a detailed breakdown of the headless observability pattern.
- Narrative observability groups correlated signals into a causal sequence, an incident summary that leads with the likely cause and treats raw metrics as supporting evidence rather than the main event, an approach explored in a piece on why engineers are moving past dashboards toward narrative observability.
- Agent-driven reflex paths keep the reaction loop local and fast, often bypassing the SaaS ingest hop entirely when milliseconds matter.
- Local-first witness monitors, small single-purpose binaries that classify failure and preserve last-known state, work well as the last line of defense when everything upstream goes dark. Projects like the NQ witness-based monitor and the single-binary TinyMon show what this looks like in practice: SQLite-backed, low-infrastructure, and built to survive partial outages.
Dashboards still earn their place for postmortems, compliance reporting, and executive visibility, where the audience needs a stable, human-readable view over time rather than a millisecond reaction.
How Do You Design a Reliable Reflex Arc?
Dropping dashboards without redesigning how signals move is how teams end up with silent failures. Five principles keep the system trustworthy.
- Instrument for meaning. Emit structured events with stable identifiers and correlation keys (trace ID, deployment ID, request ID) so data is self-explanatory without a human squinting at a graph, a discipline laid out in this first-principles look at software observability.
- Keep the reflex arc local. Route signals through your OTel Collector directly to a local automation engine for time-critical decisions, and send a second copy to long-term storage for history and audit. Routing the reflex path through a SaaS ingest queue first adds latency exactly when you can least afford it, according to analysis of reaction-path design.
- Preserve last-known state. Model failure explicitly. A monitor that goes silent should report “unknown,” never a default “zero” or “healthy,” a witness-semantics practice documented in the NQ project.
- Require traceability. Every automated action and every narrative summary needs a link back to the raw event that triggered it, so a human can audit the decision after the fact.
- Roll out behind flags. Gate new reflex rules behind feature flags, run them as shadow canaries first, and validate against a documented playbook before they get write access to anything.
Pro Tip: Run your first reflex rule in “detect and log” mode for two weeks before you let it touch remediation. You’ll catch false positives before they page someone at 3 a.m.
What Architecture Patterns Should You Pilot First?
Four patterns cover most of what teams need, and none of them require a rip-and-replace of your existing stack.
- Headless backend. Keep telemetry in Parquet or object storage, then expose a query API so agents and scripts can pull data programmatically instead of learning a vendor’s proprietary query language, the same open-storage argument made in the headless observability pattern.
- Agent tool primitives. Instead of teaching a model six different vendor dialects, expose small, focused tools: “query logs by trace ID,” “return dependency topology,” “list active deploys.” This is the Model Context Protocol pattern in practice, and it’s far more reliable than prompting a model to write ad-hoc queries against a system it doesn’t understand.
- Local reflex routing. Send critical signals from your collector to both a local witness monitor and an automation engine, then measure round-trip latency and success rate as your baseline metric.
- Live-stream pipe pattern. For transient, high-volume signals during an active incident, an SSE stream or event pipe gives on-call responders a live tail without standing up a database for data nobody needs after the incident closes, a no-backend pattern demonstrated in Hoody’s live metrics use case.
Migration recipe: pick one high-value, high-risk service. Run the reflex path and the existing dashboard in parallel for two to four weeks. Compare mean time to resolution (MTTR) and mean time to confident diagnosis (MTCD) between the two before you decide to switch. That parallel evaluation window, with conservative rollback rules set in advance, is the same staged approach recommended for reflex automation rollouts.
How Do You Decide What to Retire, Keep, or Rearchitect?
Not every dashboard deserves to die, and not every service needs a reflex path on day one. Run each candidate through six questions:
- What’s the required decision latency? Seconds favor reflex arcs; minutes tolerate a dashboard.
- Does the audience need breadth (many services at a glance) or depth (one incident, deeply)?
- What’s your forensic retention requirement, and does it match your storage cost per gigabyte?
- Can a rule or a well-scoped agent make this decision reliably, or does it need human judgment?
- Is every automated action traceable back to raw evidence for audit purposes?
- What’s the rollback plan if the new path misfires?
Before cutting anything, run a quick audit checklist:
- Who actually opens this dashboard, and how often during live incidents?
- Could a codified rule replace the human glance-and-decide step?
- What’s the cost per gigabyte of the data behind it?
- What’s the false positive and false negative rate of the proposed reflex rule?
- Is there a documented rollback if the automation misbehaves?
Keep a small set of “golden” dashboards for governance, compliance, and postmortem reporting even after you’ve moved detection and reaction elsewhere. Retire the rest gradually, not all at once.
How Does Opsphere Fit a Post-Dashboard Strategy?
Opsphere was built around the same building blocks this playbook describes: a unified operational layer, AI agents, Model Context Protocol support, and read-only integrations across AWS, GCP, Azure, Kubernetes, and the rest of your DevOps toolchain.
- Programmatic, API-first access to operational context maps directly to the headless pattern.
- AI agents that investigate and correlate events across tools support narrative observability without hand-built dashboards for every failure mode.
- Native integrations across cloud and CI/CD tooling reduce the tool sprawl that pushes teams toward dashboard overload in the first place.
| Pattern | What it needs | How Opsphere maps to it |
|---|---|---|
| Headless backend | Open API access to telemetry | Read-only integrations across many operational tools |
| Narrative observability | Cross-tool correlation | AI agents that investigate incidents across connected systems |
| Reduced tool sprawl | Unified context layer | Single operational interface via Opsphere’s platform |
A sensible first move is piloting Opsphere on the same single service you chose for your reflex-path migration test, so you’re comparing one variable at a time.
Can Alerting and Remediation Tools Replace Dashboards?
Alerting rules and automated remediation are what actually replace the “watch a dashboard and react” step, not just a philosophical alternative to it. A well-tuned alert with correlation logic attached does the job a human staring at a graph used to do, faster and without fatigue.
The key is alert correlation. Raw alerting without grouping produces noise: forty pages for one root cause during a cascading failure. Correlate alerts by trace ID, deployment window, or dependency graph before they page anyone, and you turn forty notifications into one incident with forty pieces of supporting evidence.
Automated remediation extends this further. A reflex rule that restarts a pod on a known OOM signature, or rolls back a deployment when error rates cross a threshold within a defined window, replaces the dashboard-watch-decide loop entirely for well-understood failure classes. The catch: automation should only act on signals with proven pattern history. Novel failures still need a human in the loop, routed through narrative observability rather than a raw alert.
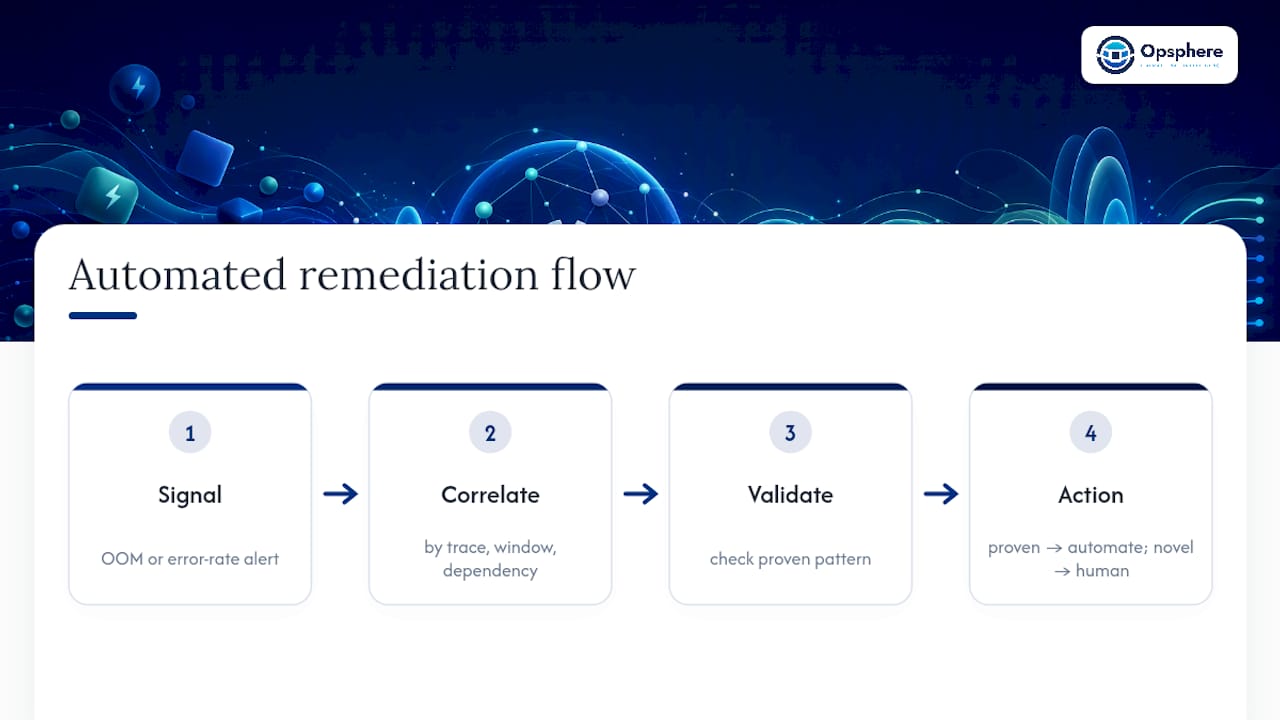
Start narrow. Automate remediation for the two or three failure modes that page your team most often, measure the false positive rate for a month, then expand. Skipping that measurement step is how automated remediation earns a reputation for making outages worse instead of shorter.
Piloting a Dashboard-Free Workflow With Opsphere
If your team is staring down forty open dashboards and still missing the root cause during a 2 a.m. page, the fix isn’t another dashboard. It’s a unified layer that already understands your infrastructure well enough to investigate for you.
Opsphere connects to the tools you already run instead of asking you to replace them, which means you keep your existing telemetry pipelines and dashboards intact while adding an agent-driven investigation layer on top. That’s the practical difference from building your own reflex arc from scratch: no six-month platform project, no new query language to teach your team, just read-only access to AWS, Kubernetes, your CI/CD pipeline, and your observability stack through one interface. For teams running platform engineering across dozens of services, that consolidation is the difference between an incident review that takes an hour and one that takes a week.
The Developer plan starts at €19 per month for individual engineers who want to test the agent-driven approach on a single service, with Team plans at €500 per month and Enterprise at €450 per month for larger rollouts, plus a free Community tier if you want to see the interface before connecting production infrastructure. Pilot it against the one service you picked for your reflex-path migration test, run it in parallel with your current dashboard for a few weeks, and compare how fast each path gets you to a confident diagnosis.
Sources
- Observability is not a dashboard
- The reaction path doesn’t need a dashboard
- Choosing to drop the vendor workspace and going headless instead
- NQ: witness-based operational monitoring
FAQ
What Replaces a Dashboard During an Incident?
A combination of structured alert correlation, narrative incident summaries, and automated reflex rules typically replaces the dashboard-watching step. The human still validates and decides, but the first read comes from a correlated narrative rather than a wall of graphs.
Is Headless Observability the Same as No Observability?
No. Headless observability keeps all the same telemetry, just accessible through open storage formats and APIs instead of a locked vendor UI, as explained in the headless observability pattern. You lose the graphical frontend, not the data.
How Long Should You Run Dashboards and Reflex Paths in Parallel?
Two to four weeks is a reasonable window for comparing MTTR and MTCD between the old dashboard workflow and a new reflex path before deciding to cut over. Shorter windows risk missing rare failure modes the new path hasn’t encountered yet.
Does Opsphere Replace My Existing Dashboards?
Opsphere doesn’t require you to rip out existing dashboards or monitoring tools. It adds a unified investigation layer with AI agents and read-only integrations across your cloud and DevOps stack, which you can pilot on Opsphere’s web client alongside whatever you already run.
What’s the Biggest Risk of Going Dashboard Free Too Fast?
The biggest risk is automating remediation on failure modes your team hasn’t seen enough times to trust the pattern. Start with detection and logging only, validate the false positive rate, and add write access to remediation later.
Recommended
This article is provided for general informational purposes only and does not constitute professional, legal, security, or compliance advice. Please evaluate recommendations against your organization’s specific environment and requirements.