
MTTR Reduction in 90 Days for SREs with Instrumentation and AI
MTTR Reduction in 90 Days for SREs with Instrumentation and AI

The fastest way to cut MTTR is unifying observability data so responders stop hunting across tools, cutting alert noise so the right signal surfaces first, automating triage and diagnosis with AI-assisted correlation, and codifying runbooks so remediation runs the moment root cause is confirmed. None of that works without full-fidelity telemetry (no sampling) and SLO-driven alerting as a foundation. Platforms like Opsphere and frameworks like DORA both point to the same conclusion: diagnosis, not remediation, is where most time disappears.
TL;DR:
- Segmentation of incident data by severity and service is necessary to identify specific bottlenecks in detection, acknowledgment, or diagnosis phases.
- Consolidating telemetry signals such as metrics, logs, topology, and recent deploys reduces diagnosis time by providing full-fidelity, context-rich insights during incidents.
- Automating runbooks with safeguards and observability can significantly lower MTTR for common, low-risk incidents like service restarts or cache clearing.
- Routing around failure through fast mitigation methods, such as process or container restarts, allows service restoration without requiring root cause resolution.
- Continuous measurement and iterative improvement, including regular runbook reviews and incident analysis, ensure MTTR reductions are sustained over time.
Table of Contents
- What MTTR Actually Measures (And Why the Average Lies to You)
- Baseline Your MTTR Before You Touch Anything
- Consolidating Telemetry So Diagnosis Takes Seconds, Not Hours
- Turning Runbooks Into Automation You Can Trust
- Routing Around Failure: Fast Mitigation Beats Perfect Fixes
- Operational Discipline: The Habits That Keep MTTR Down
- Measuring Whether Any of This Actually Worked
- Where Opsphere Fits Into This Playbook
- The Pitfalls That Undo MTTR Progress
- Why Culture Determines Whether MTTR Improvements Stick
- Making Incident Management Tools Work Together, Not Against Each Other
- Why Catching Problems Early Beats Fixing Them Fast
- Keeping MTTR Reduction From Backsliding
- What Nobody Tells You About the 90-Day Plan
- A Practical Next Step If You’re Ready to Consolidate
- Sources
What MTTR Actually Measures (And Why the Average Lies to You)
Mean Time to Repair, formally defined by the Defense Acquisition University, covers the time from confirmed failure to restored service, excluding logistics delays. That’s distinct from Mean Time to Detect (MTTD, how long until you know something’s wrong) and Mean Time to Acknowledge (MTTA, how long until a human takes ownership). Blending all three into one “MTTR” number is the single most common measurement mistake teams make.
A blended average hides which phase is actually broken. A 45-minute MTTR could mean 40 minutes of detection lag and 5 minutes of fast remediation, or the reverse. Decompose every incident using four timestamps:
- Alert fired (start of MTTD)
- Human or system acknowledged (start of MTTA)
- Root cause confirmed (start of remediation)
- Service verified restored (end of MTTR)
Mixing incident types (a database failover with a DNS misconfiguration) in the same average is the second big pitfall. Segment before you analyze.
Baseline Your MTTR Before You Touch Anything
Calculate MTTR as total repair time divided by number of incidents in a period, but always segment by severity and service. Because one high-priority outage skews the average worse than a dozen minor ones, a blended number across priorities tells you almost nothing actionable.
Prioritize which services to fix first using a simple weighting:
- Rank by impact. Revenue-facing services and anything touching customer data go first.
- Weight by frequency. A service that fails weekly deserves more attention than one that fails once a year, even if the single failure is more severe.
- Score by recoverability. Services with no automated rollback or no tested runbook sit higher on the list, since fixing the process yields compounding returns.
- Multiply the three into a rough priority score and pick your top two or three targets. Don’t try to fix everything at once.
Run a 30 day diagnostic: decompose every incident on your priority list into the four phases above. By day 60, you should know exactly whether your bottleneck is detection, acknowledgment, or diagnosis, because the fix for each is completely different.
Consolidating Telemetry So Diagnosis Takes Seconds, Not Hours
Diagnosis is where most MTTR lives. DORA-adjacent industry research puts diagnosis at 40 to 60% of total resolution time, and that share shrinks dramatically once responders stop pivoting between five different dashboards to reconstruct what happened.
Full-fidelity telemetry is the prerequisite for that shrink. Sampled data can blind automated correlation, because the one trace that would have explained the anomaly is the one that got dropped. AI-assisted correlation engines are only as good as the data they see.
Consolidate these signals first, in this order:
- Metrics and traces from your core services, ideally without aggressive sampling on error paths.
- Logs, correlated by request ID or trace ID, not just timestamp.
- Infrastructure topology, so an alert on a downstream service points back to the actual dependency that failed.
- Recent deploys and config changes, since a huge share of incidents trace back to something that shipped in the last 24 hours.
Attach that context directly to the alert. A responder who has to go find the recent deploy list has already lost two or three minutes they didn’t need to lose.
Pro Tip: Tag every deploy and config change with a timestamp and service name before it ships, not after. Retroactively reconstructing “what changed” during an active incident is one of the biggest hidden time sinks in diagnosis.
At query time, keep incident-path queries fast by pre-indexing on service and trace ID rather than relying on ad hoc full-text search during an active outage.
Turning Runbooks Into Automation You Can Trust
A runbook that lives in a wiki page is a suggestion. A runbook that executes itself is an MTTR reduction. The gap between the two is a short checklist:
- Idempotency. Running the automation twice by accident should never make things worse.
- Guards. Add preconditions that block execution if the system state doesn’t match what the runbook expects.
- Observability on the automation itself. Log every automated action so a human can audit what happened after the fact.
Start with low-risk, high-frequency automations: auto-restarting a service that’s leaked memory, clearing a cache that’s gone stale, flipping a config switch back to a known value, or rolling back a feature flag. These are the incidents that eat on-call hours without ever requiring real judgment.
AI agents fit best in three roles right now: correlating signals across systems faster than a human can, generating hypotheses about root cause for a responder to validate, and executing pre-approved, low-risk runbook steps. Full autonomous remediation on anything customer-facing still deserves a human in the loop, at least until the automation has a long track record.
Pro Tip: Track how often an AI-generated hypothesis matches the eventual root cause. If it’s right more than half the time, promote it from “suggestion” to “first thing the on-call engineer checks.”
Routing Around Failure: Fast Mitigation Beats Perfect Fixes
You don’t need to fix the root cause to restore service. You need a known good state, and a fast way back to it. AWS’s guidance on reducing MTTR frames this as routing around failure first, root-causing second.
The tradeoff is cost versus speed. Pre-provisioned standby capacity gives near-instant failover but costs money sitting idle. Load-shedding with scale-up is cheaper but slower, since new capacity takes time to come online.
Relative recovery speed matters when you’re choosing a mitigation pattern:
- Simple process restarts are fastest, typically seconds.
- Container restarts add a bit more overhead for scheduling and health checks.
- Redeploys are slower still, since they involve a full build and rollout cycle.
- Serverless invocations recover fast per-request but don’t help if the underlying function itself is broken.
Automate failover for anything with a clear, testable health check. Reserve manual failover for cases where the failure mode is ambiguous enough that automation might make the wrong call. Feature flags and canary rollbacks are the safest rollback pattern because they let you undo a change without a full redeploy.
Operational Discipline: The Habits That Keep MTTR Down
Technology alone doesn’t sustain MTTR reduction. Process does. Three practices matter most:
- Align alerts to SLOs, using burn-rate alerting so you get paged when you’re actually at risk of breaching a service-level objective, not every time a metric twitches. This is the single fastest way to cut alert noise, which several industry guides point to as the highest-leverage early win.
- Design on-call routing around ownership, with clear escalation timeouts so an alert never sits acknowledged but unaddressed. Ack-and-forget, where someone claims an alert and then doesn’t act, is a silent MTTR killer that rarely shows up in dashboards.
- Run drills and blameless post-incident reviews on a fixed cadence, then feed what you learn directly back into detection thresholds and runbook content. A PIR that doesn’t change anything downstream was a wasted hour.
Measuring Whether Any of This Actually Worked
Put these on a dashboard, segmented by service and priority, not blended: MTTR, MTTD, MTTA, incident volume, and time-to-verify (how long it takes to confirm a fix actually held).
When you roll out a new automation, test it on a cohort. Apply it to one service or one incident type first, compare MTTR before and after over several weeks, and only expand once you have a real signal rather than a hunch.
- Report MTTR trends by service, not as one company-wide number.
- Show the business case in terms stakeholders care about: fewer customer-facing minutes of downtime, fewer 3 AM pages, fewer repeat incidents.
- Treat a flat or worsening MTTR trend as a signal to revisit prioritization, not just to work harder.
Where Opsphere Fits Into This Playbook
This type of platform maps directly onto the tactics above rather than sitting alongside them as a separate tool. Unified, read-only integrations pull metrics, logs, traces, topology, and deploy history into one place, which is exactly the telemetry consolidation diagnosis depends on. AI-powered agents handle the correlation and hypothesis generation work described earlier, and runbook automation with governance controls lets teams codify the safe, idempotent automations that cut remediation time.
- A small SRE team without a dedicated observability engineer can use it to skip building custom correlation tooling.
- A platform engineering team running Terraform-native infrastructure can attach that context directly to alerts instead of maintaining a separate dashboard layer.
[Author credentials and professional background to be added.] [Case studies or client-contributed examples to be added.]
The Pitfalls That Undo MTTR Progress
Teams that improve MTTR for a quarter and then watch it creep back up almost always hit one of the same three walls.
The first is automation without guardrails. A runbook automated in a hurry, without idempotency checks or preconditions, eventually fires on the wrong system state and causes a worse outage than the one it was meant to fix. That single bad experience often makes a team distrust automation broadly, which stalls progress for months.
The second is metric gaming. Once MTTR becomes a KPI someone’s bonus depends on, incidents start getting closed early and reopened later, or severity gets quietly downgraded to keep the number clean. The dashboard looks great. The customer experience doesn’t improve at all.
The third is tool sprawl outpacing consolidation. Teams add a new observability tool for each new incident type, and within a year they have six dashboards and no single source of truth. Diagnosis time creeps back up even though every individual tool is good, because tool sprawl itself has become the bottleneck.
A quieter pitfall: treating MTTR reduction as a one-time project instead of an ongoing discipline. Teams run a big initiative, hit a good number, declare victory, and stop reviewing incidents six months later. Systems change, teams turn over, and the runbooks that worked at 50 services stop working at 200. Without a recurring review cadence, the gains erode quietly enough that nobody notices until the next major outage.
Why Culture Determines Whether MTTR Improvements Stick
The technical fixes in this guide only work if the people running incidents trust the process and each other. That’s a culture problem before it’s a tooling problem.
Blameless post-incident reviews are the clearest test. If engineers believe an honest account of what went wrong will be used against them, they’ll sand down the details, and the review produces nothing actionable. Teams with genuinely blameless reviews get far more honest timelines, which means the runbook gets updated with the real failure mode instead of a sanitized version of it.
Communication during an active incident matters just as much as communication after one. A team where the on-call engineer feels comfortable escalating early, without worrying it looks like they couldn’t handle it themselves, resolves incidents faster than a team where escalation carries a stigma. That single dynamic, escalation anxiety, quietly adds minutes to MTTA on a huge share of incidents.
Cross-team friction is the other culture cost. When an incident spans a service owned by one team and infrastructure owned by another, the resolution speed depends heavily on whether those teams already have a working relationship or whether the incident is the first time they’ve talked all quarter. Shared on-call rotations, joint drills, and simply naming a single incident commander who has authority across team boundaries all shorten that gap.
Leadership sets the tone by what it measures and what it rewards. If leadership praises quick fixes but never asks about root cause follow-through, teams learn to optimize for the applause, not the outcome. If leadership shows up to blameless reviews and asks systems questions instead of “who did this,” the whole organization calibrates accordingly.
Making Incident Management Tools Work Together, Not Against Each Other
Most enterprises don’t lack incident management tools. They lack integration between the ones they already have. A paging system, a chat platform, a ticketing system, and an observability stack that don’t talk to each other force responders to manually copy information between them during the exact moment speed matters most.
The workflow that works: an alert fires in the observability stack, automatically opens an incident channel with the relevant dashboards and recent deploys already linked, pages the right on-call rotation based on service ownership, and creates a ticket that inherits the incident timeline automatically. Every manual handoff removed from that chain is time saved on every single incident, not just the bad ones.

Version consistency matters more than people expect. If the runbook linked from the alert is three versions behind the one in the wiki, responders lose time reconciling which one to trust. Treat runbooks as code: version them, review changes, and link alerts to the canonical source, not a copy.
Escalation policies need to live in the same system that pages people, not in a separate spreadsheet someone updates quarterly. When on-call rotations change and the escalation policy doesn’t get updated in the same tool, the result is a page that goes to someone on vacation, and a delay that shows up squarely in MTTA.
The integration goal isn’t consolidating onto a single vendor. It’s making sure the systems that detect, notify, document, and remediate share context automatically, so nobody has to be the manual bridge between them during an active incident.
Why Catching Problems Early Beats Fixing Them Fast
Every tactic in this guide assumes an incident has already started. The tactics that prevent MTTR from ever needing to start are just as valuable, and they get less attention than they deserve.
Anomaly detection that flags unusual patterns before they cross a hard alert threshold gives teams a head start measured in minutes, sometimes longer. A memory leak that would eventually trigger a page at 2 AM can instead get flagged during business hours when someone’s already looking at dashboards, turning an incident into a scheduled fix.

Proactive monitoring works best when it’s tied to leading indicators, not just the lagging ones that show up after something’s already broken. Queue depth trending upward, error rates ticking above their normal baseline, latency percentiles drifting: these are the signals that let a team intervene before a customer notices anything.
The tradeoff is noise. Overly sensitive anomaly detection generates so many low-confidence alerts that teams tune it out entirely, which defeats the purpose. The fix isn’t lowering sensitivity across the board. It’s tying anomaly alerts to the same SLO-based thresholds used for hard alerting, so a flagged anomaly means something specific rather than “a number moved.”
Baseline drift is the other quiet failure mode. Retraining or recalibrating detection thresholds needs to be part of the same cadence as runbook review, not a one time setup step.
Keeping MTTR Reduction From Backsliding
MTTR improvement isn’t a project with an end date. It’s a loop, and the teams that sustain their gains treat it that way.
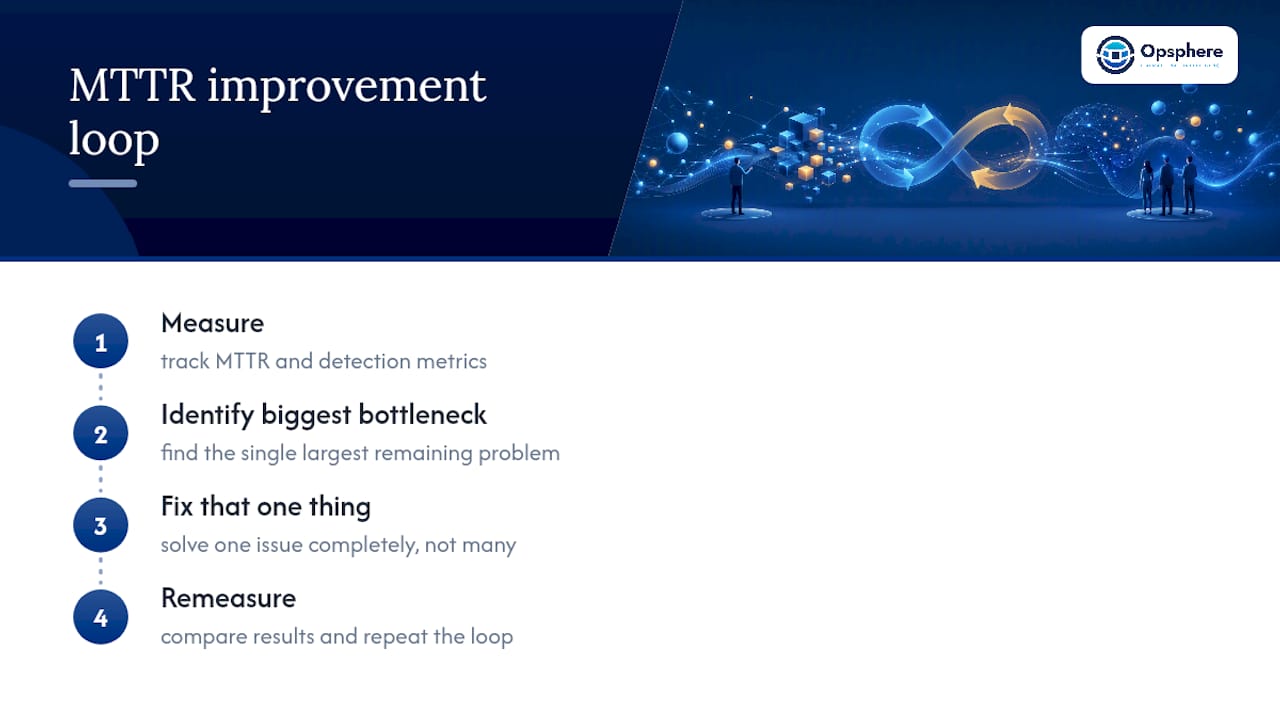
The loop looks like this: measure, identify the biggest remaining bottleneck, fix that one thing, remeasure, repeat. Trying to fix detection, diagnosis, and remediation all at once dilutes effort across three problems instead of solving one completely.
Every post-incident review should produce at least one concrete change to either detection thresholds or runbook content, not just a narrative writeup. A review that ends with “we’ll be more careful next time” has produced nothing that survives the next on-call rotation.
Schedule runbook audits on a fixed calendar, quarterly at minimum, because systems drift and a runbook that was accurate six months ago can be actively wrong today. The fastest way to erode trust in automation is letting a stale runbook fire against a system that no longer matches its assumptions.
Treat your MTTR dashboard the same way you’d treat a production metric: something that gets reviewed on a cadence, not just consulted during a crisis. Teams that only look at MTTR trends after a bad month miss the slow drift that would have been an easy fix three months earlier.
What Nobody Tells You About the 90-Day Plan
Every tactic here has a real cost. Automation carries risk. Standby capacity costs money sitting idle. Full-fidelity telemetry means more data to store and query. Accept slower remediation on your lowest-priority services deliberately, so you can move fast on the ones that matter.
If you’re starting from zero, spend the first month on instrument fidelity: stop sampling on your top services. Spend month two cutting alert noise and centralizing context into one place. Spend month three automating exactly one repeatable runbook, end to end, and measuring the before and after. Don’t try to fix everything at once. Validate each change against real incident data, not intuition, and let that evidence decide what you automate next.
— José
A Practical Next Step If You’re Ready to Consolidate
Opsphere gives you a faster path to the telemetry consolidation and AI-assisted correlation this guide keeps coming back to, without asking you to rip out and replace the tools your team already trusts. Instead of building custom pipelines to unify metrics, traces, logs, topology, and deploy history, Opsphere connects to more than 300 read-only operational tools across AWS, GCP, Azure, and Kubernetes, and puts that context in front of your team through AI Agents built on the Model Context Protocol.
That means the correlation and hypothesis work described earlier in this guide happens automatically, with governance controls that keep read-only access safe for enterprise environments. Teams running Terraform-native infrastructure or managing tool sprawl across a growing cloud footprint tend to feel the difference fastest, since consolidation is exactly where they’re currently losing the most time.
If your team is ready to see what unified operational context looks like against your own infrastructure, try the Opsphere web client and connect your first integration today.
Sources
- Reducing MTTR - Availability and Beyond
- How to Reduce MTTR with AI: The 2026 Guide
- DAU glossary: mean time to repair