
6–8 Week Incident Triage Automation Plan for SREs and SOC Analysts
6–8 Week Incident Triage Automation Plan for SREs and SOC Analysts

Incident triage automation applies deterministic rules and AI agents to collect, enrich, and score incoming alerts, then routes each one to the right owner with supporting evidence attached. The result is consistent prioritization at a speed no manual process can match, provided the underlying telemetry is clean and a human stays in the approval loop for high-risk actions.
TL;DR:
- Triage automation requires centralized logs, accurate asset inventories, and a clear use case with measurable outcomes before implementation.
- Applying layered decision rules and retaining full evidence trails at each stage ensures a trustworthy, auditable triage process.
- Pre-filtering alerts with inexpensive logic before using costly AI reasoning improves speed and reduces hallucinations and errors.
- Guardrails including approval gates, safety controls, and policy checks are essential to prevent unintentional or high-impact actions by AI agents.
- A shadow mode pilot over several weeks allows for validation of automation accuracy and speed improvements before full rollout.
Table of Contents
- TL;DR: The Takeaway and Your Next Step
- What Incident Triage Automation Is and Where It Fits
- Why Manual Alert Prioritization Breaks at Scale
- The Incident Triage Automation Pipeline, Step by Step
- Design Principles That Keep Triage Automation Trustworthy
- A 6-to-8 Week Implementation Plan You Can Follow
- Where Agentic AI Helps, and Where It Needs a Leash
- Measuring Whether Triage Automation Is Working
- How Opsphere Implements These Patterns
- Get Started With Opsphere for Unified Triage Automation
- Sources
- FAQ
TL;DR: The Takeaway and Your Next Step
Alert volume outpaces analyst capacity at most organizations running distributed systems, and manual triage collapses under that load long before headcount can catch up. Incident triage automation fixes this by applying the same enrichment and scoring logic to every alert, producing a ranked, evidence-backed queue instead of a pile of undifferentiated noise.
Before building anything, confirm your foundation is ready:
- Centralized, structured logs from your core services and infrastructure.
- An up-to-date asset or service inventory tied to ownership.
- At least one clear, narrow use case with a measurable outcome.
- A defined escalation path for anything the automation flags as uncertain.
The practical next step is a small pilot: pick one alert type, define what “correctly triaged” means for it, and measure your current manual baseline before automating anything.
What Incident Triage Automation Is and Where It Fits
Incident triage automation is the layer that sits between detection and investigation. It takes a raw alert or signal, decides how urgent it is, attaches the context an analyst needs to act, and routes it to the right team or playbook. It does not perform remediation, and it does not replace investigation: it decides what deserves attention first and hands off a structured starting point.
The NIST SP 800-61 Computer Security Incident Handling Guide frames this clearly: written prioritization guidelines and consistent logging standards are prerequisites for any automated initial analysis, and automation’s effectiveness is capped by the quality of the data feeding it.
A well-built triage automation step typically produces:
- An evidence bundle: the logs, metrics, and traces relevant to the alert.
- A confidence score reflecting how certain the system is about severity and cause.
- A suggested playbook or runbook reference based on the alert’s classification.
- A routing decision naming the team or on-call rotation responsible.
Triage sits upstream of investigation, which is where an analyst validates the hypothesis, and further upstream of remediation, where changes get made. Keeping these boundaries explicit matters operationally: a triage system that starts taking remediation actions on its own introduces risk that most SOC and SRE teams are not equipped to govern. Triage automation succeeds when it makes the next step obvious, not when it tries to complete every step itself.
Why Manual Alert Prioritization Breaks at Scale
Manual triage works fine at low volume with a small, stable system. It stops working once alert counts climb, services multiply, and on-call rotations turn over faster than institutional knowledge can be passed along. A few specific failure modes show up repeatedly.
- Alert duplication: the same underlying issue fires across multiple monitoring tools, and analysts spend time correlating what automation could correlate instantly.
- Inconsistent severity judgments: two analysts on different shifts assign different priority to the same type of event, producing unreliable SLAs.
- Missing context at the moment of decision: an analyst sees a metric spike but not the recent deploy, config change, or dependency failure that explains it.
- Cognitive load and alert fatigue: sustained high alert volume degrades judgment quality over a shift, not just throughput.
Tool sprawl makes all of this worse. When observability, cloud infrastructure, CI/CD, and security tools each hold a fragment of the relevant context, no single analyst can assemble the full picture fast enough to triage accurately under pressure. Consistent prioritization requires unified context: one place where identity, asset, change, and business-impact data are already joined to the alert, not four browser tabs an analyst has to reconcile manually while the clock runs on mean time to acknowledge.
The Incident Triage Automation Pipeline, Step by Step
A production-grade triage pipeline breaks into four stages, each with specific inputs, outputs, and failure points engineers need to design around.
- Collect and normalize. Ingest alerts, logs, metrics, and traces from every relevant source, then normalize them into a common schema. Required telemetry typically includes application logs, infrastructure metrics, deployment events, and security signals. Normalization matters because a triage rule written against one tool’s field names breaks silently when a second tool uses different naming.
- Enrich. Attach the context that turns a raw event into something decidable: asset ownership, identity and access data, recent change history, and business-impact metadata such as which customer-facing service is affected. This is the stage where “a pod restarted” becomes “a pod restarted on the checkout service, ten minutes after a config deploy, owned by the payments team.”
- Apply decision logic. Run the enriched alert through deterministic rules first, then decomposed triage rules for more nuanced cases, and reserve LLM-based reasoning for the candidates that survive earlier filters. Research on decomposed triage rule models shows this approach improves both accuracy and explainability compared to end-to-end black-box matching, because each rule can be audited and reused independently rather than treated as an opaque scoring function.
- Create the case and route it. Package the evidence bundle, confidence score, and suggested playbook into a case record, assign ownership based on the enriched asset data, and apply the SLA that matches the assigned severity. Store the full reasoning trail alongside the case: which rules fired, what data supported the score, and what alternatives were considered.
Pro Tip: Log every triage decision with its full evidence trail from day one, even before you trust the automation. That history is what lets you validate accuracy later and retrain rules with confidence.
What you store at each stage determines whether the system stays auditable. At minimum, retain the raw input, the enriched record, the rule or model output with a confidence score, and the final routing decision, all timestamped and queryable. This is not just for compliance: it is the dataset you will use to measure whether the automation is actually improving triage outcomes, and it is what lets a downstream investigator understand why a case was prioritized the way it was without re-deriving the logic from scratch.
Design Principles That Keep Triage Automation Trustworthy
The gap between a triage system engineers trust and one they route around usually comes down to five design choices.
- Data hygiene first. NIST’s guidance is direct on this point: automation requires good input data to perform initial analysis reliably, and no amount of downstream logic compensates for inconsistent logging upstream.
- Decomposed, modular triage rules. Instead of one large model trying to classify every alert type, break triage logic into smaller, reusable rules that each handle a specific pattern, which makes the system easier to test, extend, and debug.
- Interpretable reasoning trails. Every automated decision should come with a visible chain of what was checked and why, not just a final label.
- Pre-filtering before expensive reasoning. Coarse, cheap filters should eliminate the bulk of low-signal candidates before any LLM-based step runs on the remainder.
- Layered safety controls. Typed tools, policy gates, human approval steps, and audit logs should wrap any action with real operational consequence.
A hybrid architecture that filters candidates with inexpensive ranking before applying LLM-based analysis to the survivors improves both speed and accuracy for triage and root-cause tasks, according to production research on ranking-plus-agent systems. That ordering matters because LLM reasoning is the most expensive and most failure-prone step in the pipeline: feeding it pre-filtered, structured candidates rather than raw telemetry sharply reduces the risk of hallucinated conclusions.
Google’s SRE organization applies a similar layering logic to agentic tools in production. Their documented approach to Gemini CLI in real-world outage response classifies actions by risk level and gates anything destructive or high-impact behind policy checks and multi-person approval, treating the agent as a copilot rather than an autonomous operator. For a deeper look at how layered guardrails apply specifically to AI agents, see this breakdown of agent security from The AI Orchestrators.

A 6-to-8 Week Implementation Plan You Can Follow
Rolling out triage automation works best as a scoped pilot rather than an all-at-once cutover.
- Weeks 1 to 2: readiness check. Confirm you have centralized logs, an accurate service or asset inventory, identity data, and a change feed that captures deploys and config updates. Gaps here should be fixed before any rule is written.
- Week 2: pick a narrow use case. Choose one alert type with clear ground truth, such as a specific class of latency alert or a well-understood security signal, and define what “correct triage” means for it in measurable terms.
- Weeks 3 to 5: author rules incrementally. Start with deterministic rules for the clearest cases, add decomposed triage rules for nuanced variations, and route anything ambiguous to a human reviewer rather than guessing.
- Weeks 5 to 6: validate against analyst judgment. Run the automation in shadow mode alongside manual triage, compare outputs, and adjust rules based on where the two diverge.
- Weeks 6 to 8: controlled rollout with rollback. Enable automated routing for the pilot use case with a documented rollback path, then widen scope only after the metrics hold up.
Pro Tip: Run shadow mode longer than feels necessary. The rules that look right in testing often reveal edge cases only after a few real on-call rotations have seen them.
Governance should not be an afterthought bolted on after the pilot succeeds. Assign clear ownership for the triage rule set, require change review before rules go live, and build a feedback loop where analyst overrides feed back into rule tuning. Teams running lean, such as small SRE teams without dedicated automation engineers, benefit from starting with the fewest rules that solve the most common alert pattern rather than trying to cover every scenario at launch. A practical playbook for piloting and scaling AI agents in operations, including governance and measurement phases, is available from Sentient Concepts.

Where Agentic AI Helps, and Where It Needs a Leash
Agentic AI earns its place in triage when the task requires synthesizing scattered evidence into a coherent hypothesis, something rule-based logic alone struggles with. It is well suited to summarizing what changed recently across a stack, generating a ranked list of likely root causes, and suggesting which playbook fits the pattern it observed.
The same flexibility that makes agents useful also makes them risky without guardrails.
- Data noise causes hallucination. Feeding raw, unfiltered telemetry to an LLM-based agent increases the odds of a confident but wrong conclusion, which is why pre-filtering matters before reasoning steps run.
- Overreach without a reasoning trail erodes trust. On-call engineers reject agent outputs they cannot verify, regardless of how often those outputs turn out correct.
- Unbounded action scope is the biggest operational risk. An agent with write access and no policy gate can turn a wrong hypothesis into a wrong action.
The controls that address this are the same ones Google SRE documents for its Gemini CLI workflows: deterministic toolkits for anything with real consequence, risk metadata attached to every proposed action, explicit approval gating for high-impact steps, and an audit trail covering the full decision chain. Teams integrating their own models into a triage workflow should look for platforms that support this kind of transparent, auditable reasoning rather than opaque model output with no trace.
Measuring Whether Triage Automation Is Working
Three or four KPIs cover most of what matters: median time to acknowledge as a proxy for triage speed, triage accuracy against a human-reviewed baseline, false positive rate on the automated queue, and analyst hours saved per week on the pilot use case.
A simple experiment design works well for the pilot:
- Run the automation in shadow mode against a control group of manually triaged alerts for two to four weeks.
- Compare median time to acknowledge and accuracy between the automated and manual queues over the same observation window.
- Hold the alert type and team constant across both groups to isolate the effect of the automation itself.
Consistent logging standards and written prioritization guidelines are prerequisites for automation to perform initial analysis reliably, according to NIST SP 800-61. Once the baseline is established, tune the rules that produced the most overrides or false positives, then re-measure over the next observation window rather than declaring victory on the first pass.
How Opsphere Implements These Patterns
Opsphere unifies operational context across AWS, Kubernetes, observability, CI/CD, and security tools into a single interface, which is the same unified context that consistent triage depends on. It combines AI Agents with Model Context Protocol and more than 300 read-only operational tools to build evidence-backed investigation workflows rather than single-shot guesses, keeping each tool’s data as the source of truth instead of duplicating telemetry into a separate store.
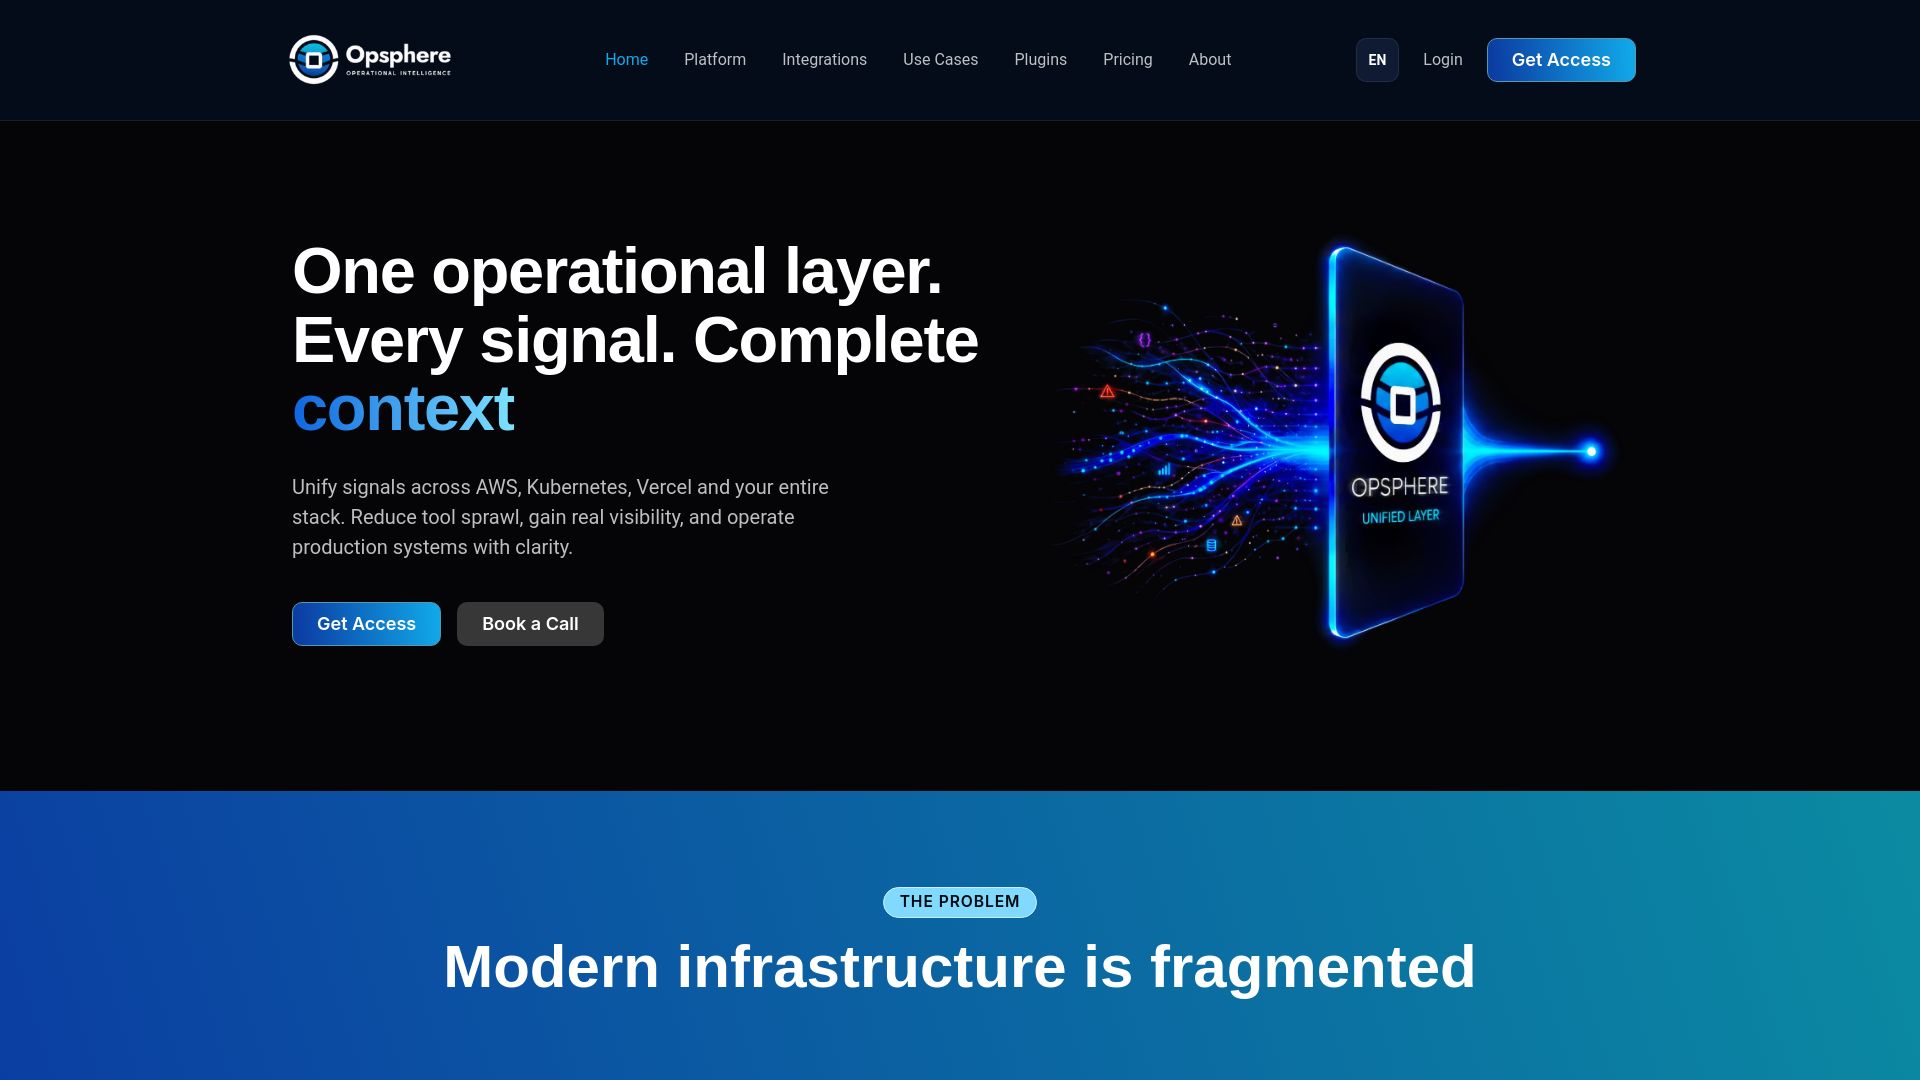
For teams dealing with tool sprawl across cloud, observability, and security systems, that unification removes the manual correlation step that slows triage down and improves handoffs between the analyst who triages an alert and the engineer who resolves it. Because actions run through read-only tools with strict governance, agentic reasoning stays auditable without exposing production systems to unsupervised write access.
Get Started With Opsphere for Unified Triage Automation
Opsphere gives engineering and SRE teams a single operational layer to run the triage patterns covered in this guide without ripping out the tools already in place. It connects to your existing AWS, Kubernetes, observability, CI/CD, and security stack, so the enrichment step that normally takes analysts several browser tabs to assemble happens automatically, with evidence packaged and traceable.
Teams evaluating whether to build this pipeline in-house or adopt a unified layer can start with the Developer plan at €19 per month to test the workflow on a real environment, or review Team and Enterprise options for larger rollouts. Platform engineering teams handling frequent handoffs between triage and remediation may also find the platform engineering use case directly relevant to their rollout plan. Check the pricing page to find the plan that matches your team’s current pilot scope.
Sources
The sources behind this guide are worth reading directly if you are designing your own pipeline.
- How Google SREs use Gemini CLI to solve real-world outages | Google Cloud Blog
- Computer Security Incident Handling Guide (NIST SP 800-61r2)
- Intelligent Triage: Interpretable Incident Triage Workflow using LLM Extracted Triage Reasoning | ACM
FAQ
What is incident triage in the context of automation?
Incident triage is the process of assessing an incoming alert, determining its severity and likely cause, and deciding where it should be routed for further action. In automated systems, this involves collecting and normalizing telemetry, enriching it with context, and applying decision logic to produce a scored, routed case, as outlined in NIST’s incident handling guidance.
How can I automate incident response without losing control?
Automate the triage and enrichment stages first, since these carry lower operational risk than automated remediation. Keep any action with real consequence, such as a restart or a rollback, behind a policy gate and human approval, following the layered safety model Google SRE documents for agentic workflows.
What are the stages of the incident management process?
Incident management generally moves through preparation, detection and analysis, containment, eradication and recovery, and post-incident review, a structure reflected in NIST SP 800-61. Triage automation sits inside the detection and analysis stage, deciding priority and routing before containment work begins.
What tools are commonly used for incident management?
Teams typically combine observability platforms, alerting systems, and case management tools to detect, prioritize, and track incidents through resolution. Unified operational intelligence platforms like Opsphere add a layer on top of these tools that correlates context across them for faster, more consistent triage.
How do I know if triage automation is actually working?
Track median time to acknowledge, triage accuracy against human review, and false positive rate before and after rollout using a shadow-mode comparison. If accuracy holds and override rates drop over a few observation windows, the automation is earning its place in the pipeline.
Recommended
This article is provided for general informational purposes only and does not constitute professional, legal, security, or compliance advice. Please evaluate recommendations against your organization’s specific environment and requirements.