
Evidence Grounded Automated RCA for SREs: 4 Phase Rollout
Evidence Grounded Automated RCA for SREs: 4 Phase Rollout
Automated root cause analysis uses AI and correlation logic to trace an incident from its symptoms back to the failing component, cutting the manual investigation time that normally drives up mean time to resolution. It works by ingesting logs, metrics, traces, and topology data, then ranking probable causes against a dependency graph instead of forcing an engineer to grow through dashboards. Before adopting it, verify your telemetry coverage and service dependency mapping are solid. Weak inputs produce confident, wrong answers faster than a human ever could.
TL;DR:
- Automated RCA depends heavily on comprehensive telemetry, including metrics, logs, traces, and deployment data, to produce accurate diagnoses.
- Using validated causal graphs and well-tuned small language models improves detection accuracy while keeping costs manageable.
- Building and maintaining a unified, cross-cloud dependency graph and ensuring consistent naming conventions are essential for multi-cloud environments.
- Phased rollout with read-only monitoring and clear exit criteria helps prevent trust erosion from false positives or incorrect diagnoses.
- Evidence-backed explanations, linking causes to specific data points, are crucial for operator trust and effective incident resolution.
Table of Contents
- What Automated Root Cause Analysis Means for SRE and DevOps Teams
- The Core Architecture Behind an Automated RCA System
- Which AI Techniques Actually Power Root Cause Detection?
- What Data Do You Need Before You Automate RCA?
- Where Automated RCA Breaks: Failure Modes and Fixes
- How Do You Roll Out Automated RCA Without Breaking Trust?
- Which Metrics Prove Automated RCA Is Working?
- Data Privacy and Security Considerations in Automated RCA
- How Automated RCA Fits Into Incident Management and Alerting
- Managing Automated RCA Across Multi-Cloud and Hybrid Environments
- Preprocessing and Feature Engineering Practices That Improve RCA Accuracy
- Why Explainability Matters for AI-Driven Root Cause Diagnosis
- Where Opsphere Fits Into Your Automated RCA Rollout
- Sources
- FAQ
What Automated Root Cause Analysis Means for SRE and DevOps Teams
Automated root cause analysis, often shortened to automated RCA, is the practice of using algorithms, correlation engines, and increasingly AI agents to identify which upstream failure explains a set of downstream symptoms, without a human manually stitching together logs, dashboards, and tribal knowledge.
It operates in two distinct modes. Real-time RCA runs during an active incident, correlating fresh signals to surface a probable cause while the pager is still going off. Retrospective RCA runs after resolution, mining incident history to find patterns human reviewers miss, feeding a knowledge base that makes the next real-time diagnosis faster.
Neither mode replaces the on-call engineer. What they change is where that engineer spends time.
- Real-time RCA cuts the triage phase, the part where you are still asking “what is even broken?”
- Retrospective RCA improves the postmortem, surfacing contributing factors that never made it into the incident timeline
- Both modes depend entirely on the quality of the telemetry feeding them
Teams that measure this well track time-to-diagnosis separately from total MTTR, because a fast diagnosis with a slow remediation still looks like a slow incident on paper.
The Core Architecture Behind an Automated RCA System
An automated RCA system is a data pipeline first and an AI model second. Get the pipeline wrong and no amount of model sophistication saves you.
- Ingestion and normalization. Logs, metrics, traces, deployment events, and configuration metadata arrive from different tools in different formats and different clocks. Normalization aligns timestamps, tags, and service identifiers so a log line from one system can be correlated against a metric spike from another.
- Correlation and retrieval layer. This layer clusters related alerts, suppresses duplicates, and retrieves semantically similar past incidents from a historical index. Research on the eARCO framework found that combining prompt optimization with retrieval of similar historical incidents raised RCA recommendation accuracy by 21% over standard retrieval-augmented approaches.
- Service dependency graph. A live topology map, built from service mesh data, API calls, or infrastructure-as-code metadata, tells the system which services can plausibly cause failures in which other services. Without it, correlation becomes coincidence hunting.
- Inference engine. This is where causal ranking happens, whether through statistical causal graphs, a large language model reasoning over evidence, or a hybrid of both. The output should be a ranked list of probable causes, not a single unverifiable answer.
- Human verification hooks. Every ranked cause needs a path for an on-call engineer to confirm, reject, or amend it, and that decision needs to feed back into the system.
- Evidence and audit storage. The specific log lines, metric windows, and trace spans that justified a diagnosis get stored alongside it, so the reasoning can be audited weeks later.
Building this in-house means owning all six pieces and keeping them in sync as your infrastructure changes. That is precisely the workload an operational intelligence platform is built to absorb, unifying the ingestion, graph construction, and evidence trail into one layer instead of six separate projects.
Which AI Techniques Actually Power Root Cause Detection?
Not every “AI-powered” RCA tool uses the same technique, and the differences matter for cost, latency, and how much you can trust the output.
Causal graph inference builds a statistical model of which metrics influence which others, then traces an anomaly back through that graph. It is fast and interpretable at moderate scale, but accuracy degrades as the graph grows, and rebuilding it for every new service is expensive. The MetaRCA framework addresses this by building a Meta Causal Graph offline and instantiating a smaller, localized graph at inference time, reporting near-linear overhead scaling as system size grows.
LLM-based reasoning and agent frameworks read logs and traces the way a senior engineer would, generating a narrative explanation instead of just a ranked score. This is powerful for surfacing causes a rigid statistical model would miss, but it introduces hallucination risk. A structured reasoning framework for telecom RCA found that grounding LLM outputs in canonical system context and verified telemetry was essential to prevent the model from inventing plausible-sounding but false explanations.
- Causal graphs: fast, interpretable, weaker at scale
- LLM agents: flexible, transparent reasoning, higher compute cost and hallucination risk
- Prompt-optimized small models: most of the accuracy at a fraction of the cost
- Hybrid offline/online graphs: scalable structure with lightweight runtime inference
Prompt optimization and domain-adapted small language models offer a middle path. The eARCO research found that fine-tuned small models paired with optimized prompts improved accuracy by 13% over incident-context-only baselines, at a fraction of the inference cost of a large general-purpose model.
Pro Tip: Do not default to the biggest model available. A smaller model with a well-tuned prompt and good retrieval, similar to the eARCO approach, often beats a larger model reasoning from scratch, at a lower per-incident cost.
What Data Do You Need Before You Automate RCA?
Every automated RCA system runs on what practitioners call the data plane, and its quality determines whether the system produces grounded diagnoses or confident guesses.
Required telemetry falls into four categories, and gaps in any one of them create blind spots the model cannot reason around:
- Metrics with consistent naming and enough retention to compare against historical baselines
- Logs structured enough to parse reliably, not just free text dumped into a search index
- Distributed traces that connect a request across every service it touches
- Deployment and change events, since a huge share of incidents trace back to something that changed recently
Beyond raw telemetry, the system needs ancillary context: recent deployment metadata, configuration changes, existing runbooks, and a searchable history of past incidents with their confirmed root causes. This is why AI-native engineering teams treat context completeness as a prerequisite, not a nice-to-have.
Quality control matters as much as coverage. Inconsistent service naming across teams, unsynchronized clocks between data centers, and telemetry retention policies that discard data before it is useful all quietly break the correlation layer. Fix these before you add AI, not after.
Where Automated RCA Breaks: Failure Modes and Fixes
Automated RCA fails in predictable ways, and each one has a known mitigation.
Hallucination and unstable reasoning top the list for LLM-based systems. A model under pressure to produce an answer will sometimes generate a plausible-sounding cause with no basis in the actual telemetry. The fix, confirmed across multiple frameworks, is requiring the model to cite exact evidence, specific log lines, metric windows, or trace spans, and validating those citations against the source data before presenting a diagnosis. Agentic RCA research found that evidence-grounded reasoning traces both improved diagnostic transparency and gave on-call engineers something concrete to verify.
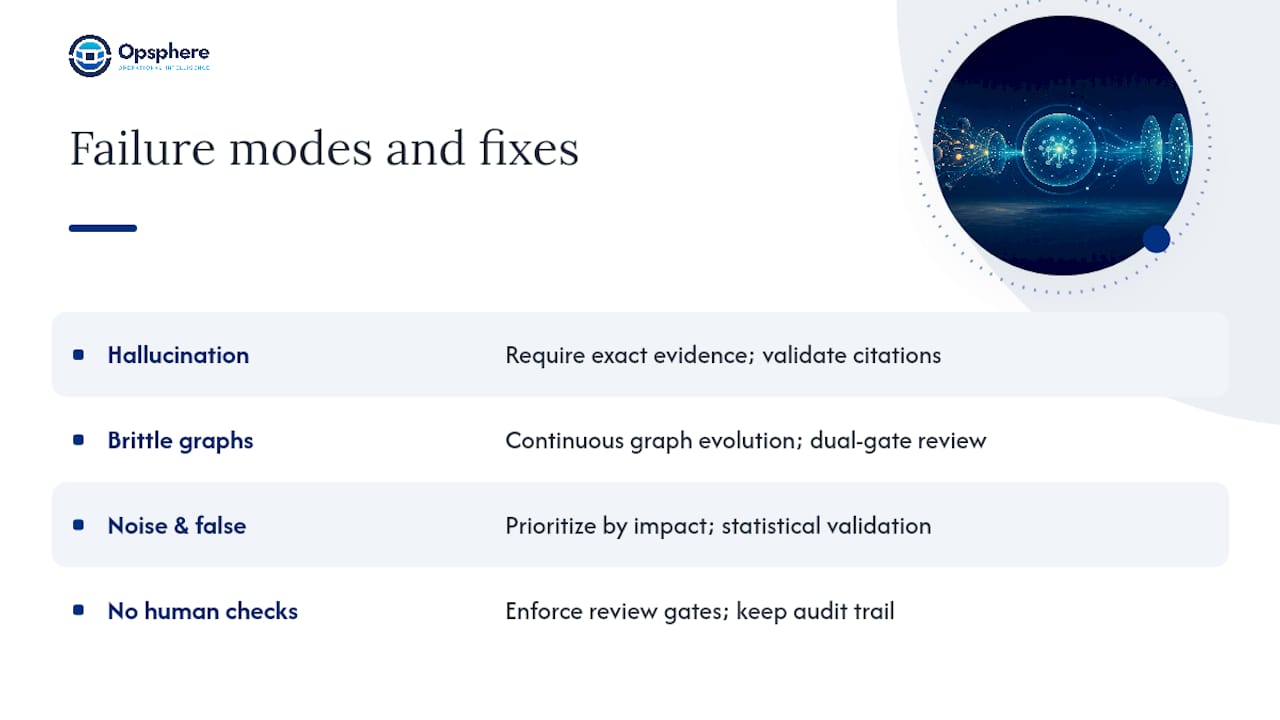
Brittle or overfitted causal graphs happen when a graph trained on last quarter’s architecture cannot generalize to this quarter’s microservices. The fix is continuous graph evolution paired with a dual-gate verification process, where updates only get promoted after passing both automated and human review. A self-evolving harness approach found this outperformed periodically rebuilding specialized agents from scratch.
Noise and false positives overwhelm on-call engineers faster than any single bad diagnosis. Effective systems prioritize by business impact, not alert volume, and require statistical validation before surfacing a cause.
Systems that skip human-in-the-loop verification and audit trails before enabling automated remediation are the ones most likely to lose operator trust after a single bad call, a pattern reflected across production RCA deployments studied in the RCACopilot on-call research.
Operational controls that consistently work: confidence thresholds below which the system defers to a human, mandatory review gates before any automated action, and a permanent audit trail of every diagnosis and its outcome.
How Do You Roll Out Automated RCA Without Breaking Trust?
Rushing straight to automated remediation is how teams end up distrusting the whole system after one bad diagnosis. A phased rollout protects both your infrastructure and your team’s confidence in the tool.
- Phase 0, instrumentation audit. Map what telemetry you actually have against what the system needs. Fix naming inconsistencies and coverage gaps now, before any model touches the data.
- Phase 1, build the graph and index. Construct your service dependency graph and historical incident index. This is infrastructure work, not AI work, and it takes longer than most teams expect.
- Phase 2, read-only pilot. Run the system in shadow mode, generating diagnoses that engineers review but never act on automatically. Track how often the top-ranked cause matches what the human eventually confirms.
- Phase 3, graduated automation. Once top-1 accuracy and human-confirm rate clear your internal threshold, allow the system to trigger notifications or suggested runbooks, still short of automated remediation.
Keep every integration read-only and least-privilege through Phase 2. A system that can only read telemetry and dependency metadata cannot make an incident worse by acting on a wrong diagnosis, which is why platforms built around reducing tool sprawl emphasize read-only connectors as a default, not an afterthought.
Pro Tip: *Set your Phase 2 exit criteria before you start the pilot, not after you see the results.
Which Metrics Prove Automated RCA Is Working?
Three categories of metrics tell you whether the investment is paying off, and teams that only track MTTR miss the half of the story that explains why it moved.
Operational KPIs measure the business impact: mean time to resolution, time-to-diagnosis, and mean time to acknowledge. Diagnosis metrics measure the model’s accuracy directly, and operational health metrics tell you whether engineers actually trust the tool.
| Metric category | Key metrics | What it tells you |
|---|---|---|
| Operational KPIs | MTTR, time-to-diagnosis, MTTA | Whether incidents resolve faster in wall-clock terms |
| Diagnosis accuracy | Top-1/top-k accuracy, precision, recall, evidence coverage | Whether the model’s ranked causes match confirmed root causes |
| Operational trust | False positive rate, human override rate, escalation frequency | Whether engineers actually rely on the system’s output |
- Review diagnosis accuracy weekly during pilot phases, monthly once stable
- Track human override rate as an early warning sign before trust erodes visibly
- Feed every confirmed or rejected diagnosis back into the historical index
A falling override rate alongside a rising top-1 accuracy is the clearest signal a rollout is on track.
Data Privacy and Security Considerations in Automated RCA
Automated RCA systems touch some of the most sensitive data in your infrastructure: production logs, configuration secrets, customer request traces, and internal architecture details that reveal exactly where your weak points are.
The first control is scope. An RCA system needs read access to telemetry and metadata, not write access to production systems, and definitely not standing credentials that could be repurposed for anything beyond diagnosis. Least-privilege, read-only integrations should be a hard requirement in any vendor evaluation, not a checkbox feature.
The second control is data handling within the correlation and inference layers. If your pipeline sends log data to a third-party LLM API for reasoning, you need clarity on retention, whether that data trains future models, and whether personally identifiable information gets scrubbed before it ever leaves your environment. Regulated industries, healthcare, finance, government contracting, often cannot use externally hosted inference at all without contractual data processing guarantees.
The third control is auditability. Every diagnosis, every piece of evidence cited, and every human override needs to be logged and retrievable. This matters for security investigations as much as for trust in the model. If an incident later turns out to involve a security breach rather than an infrastructure fault, your RCA audit trail becomes part of the forensic record.
Teams evaluating tools should ask directly: what data leaves our environment, where does it go, and who can see it? Vague answers here are a bigger red flag than any accuracy benchmark.
How Automated RCA Fits Into Incident Management and Alerting
Automated RCA does not replace your incident management platform or your alerting pipeline. It sits between them, turning a raw alert into a diagnosis your existing tools can act on.
The typical flow starts when an alerting system, whether threshold-based or anomaly-driven, fires a signal. Instead of routing that signal straight to a human, it passes through the correlation layer first, which checks whether it is part of a known cluster of related alerts and whether a probable cause is already surfacing from the dependency graph. Only the enriched alert, cause hypothesis and supporting evidence attached, reaches the on-call engineer through the incident management platform.
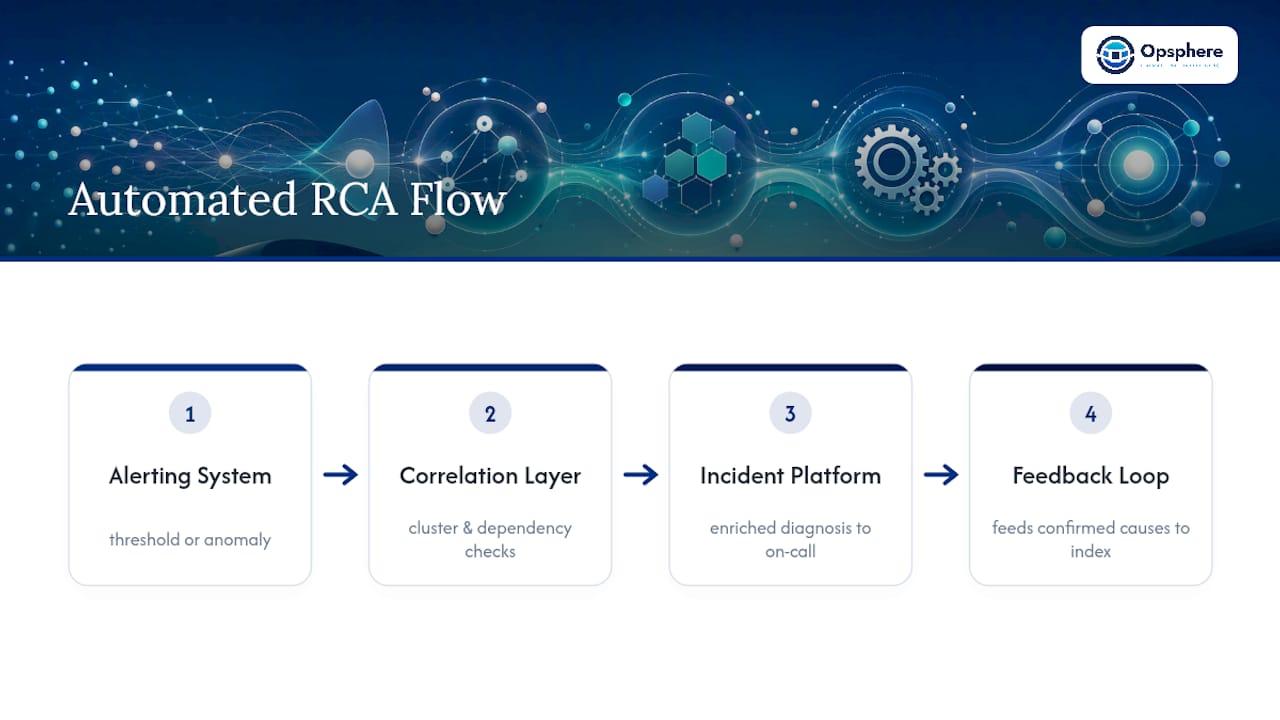
This changes what a page looks like in practice. Instead of “checkout-service latency above threshold,” an engineer receives “checkout-service latency spike, correlated with a deployment to payment-gateway 12 minutes prior, confidence high, evidence attached.” That is the difference between an alert and a diagnosis.
Integration depth matters more than integration breadth. A system that pulls context from your existing observability stack, CI/CD pipeline, and cloud provider APIs without requiring you to rip out and replace any of them gets adopted faster than one that demands a new tool for every data source. Bidirectional integration also matters: the incident management system needs to feed confirmed root causes back into the RCA system’s historical index, closing the feedback loop that makes future diagnoses more accurate.
Managing Automated RCA Across Multi-Cloud and Hybrid Environments
Multi-cloud and hybrid infrastructure breaks the simplifying assumptions that make single-cloud RCA tractable, and most teams underestimate this until they hit it.
The core problem is inconsistent telemetry formats and naming conventions across providers. AWS CloudWatch, Azure Monitor, and Google Cloud Operations each structure metrics and logs differently, and a service dependency graph that only understands one provider’s topology model cannot trace a request that crosses from an on-premises data center into a cloud VPC and back.
Three practical adjustments make multi-cloud RCA workable:
- Normalize at ingestion, not at inference. Every cloud and on-premises source needs to map into a common schema before it reaches the correlation layer, not be reinterpreted differently by each downstream component.
- Build one unified dependency graph, not one per environment. A request that crosses cloud boundaries needs a single topology view; siloed graphs per provider will each show a “healthy” upstream service while missing the actual cross-boundary failure.
- Account for network latency and clock drift between environments. Hybrid setups often have less precise time synchronization than a single data center, and even small clock drift corrupts correlation windows.
Platform engineering teams managing shared infrastructure across providers tend to solve this by consolidating operational context into a single layer rather than maintaining separate RCA tooling per cloud, which is the approach platform engineering teams increasingly favor over per-provider point solutions. The alternative, running three different RCA tools for three different clouds, means the diagnosis for a genuinely cross-cloud incident never gets made at all, because no single tool has visibility into the whole path.
Preprocessing and Feature Engineering Practices That Improve RCA Accuracy
The inference engine gets the credit when automated RCA works well, but the preprocessing pipeline usually deserves it.
Timestamp alignment comes first. Logs, metrics, and traces arriving with even a few seconds of clock skew across services will correlate incorrectly, attributing a symptom to the wrong cause simply because the timing looked right. Normalize every source to a single clock reference, ideally UTC with sub-second precision, before anything else happens.
Entity resolution matters just as much. The same service might appear as checkout-svc, checkout_service, and checkout-prod-v2 across different tools, and unless these get resolved to one canonical identifier, your dependency graph will treat them as three unrelated nodes. This single issue quietly breaks more RCA deployments than any modeling choice.
Feature engineering for RCA specifically benefits from a few practices that generic anomaly detection pipelines skip:
- Encode deployment recency as an explicit feature, since a change in the last hour is a far stronger causal signal than one from three weeks ago
- Represent alerts as clusters, not individual events, so the model reasons about correlated symptom groups instead of isolated noise
- Include topology distance from the alerting service as a feature, since causes closer in the dependency graph are statistically more likely than distant ones
- Preserve raw evidence snippets alongside engineered features, so the inference layer can cite them directly rather than reconstructing them after the fact
Retention policy is the quiet failure point here. If your logging pipeline discards raw log lines after seven days but your incident review cadence runs monthly, the RCA system loses its evidence base exactly when it is needed for validation. Align retention windows to your actual review cadence, not an arbitrary storage budget.
Why Explainability Matters for AI-Driven Root Cause Diagnosis
An automated RCA system that cannot show its reasoning will eventually get ignored, no matter how accurate its benchmark scores look. On-call engineers under pressure will not act on a diagnosis they cannot verify in the time it takes to read it.
Explainability in this context means two specific things: the system shows which evidence it used, and it shows how that evidence connects to the conclusion. A ranked list of probable causes with a confidence score is not explainable on its own. A ranked list where each cause links to the specific log lines, metric windows, and trace spans that support it, and shows the path through the dependency graph connecting symptom to cause, is.
This is where evidence-grounded reasoning frameworks distinguish themselves from black-box scoring models. Research on agentic RCA frameworks found that requiring the system to cite exact evidence, and validating those citations against source data, both reduced hallucinated conclusions and gave engineers a concrete artifact to audit, a pattern consistent with the agentic evidence-grounded reasoning research cited earlier for failure mitigation.
Transparency also protects you during postmortems and compliance reviews. If a regulator or an internal audit asks why an automated system flagged, or failed to flag, a particular cause, “the model said so” is not an answer. “The model cited these three log lines and this deployment event, and here is the confidence score it assigned” is. Build the evidence trail into the system from day one. Retrofitting explainability after a black-box model is already in production is considerably harder than designing for it from the start.
Where Opsphere Fits Into Your Automated RCA Rollout
Opsphere works as the operational intelligence layer that connects your existing observability, cloud, and DevOps tools into one investigation surface, so you get dependency-aware, evidence-backed diagnosis without ripping out what you already run.
If you are evaluating a platform for automated root cause analysis, test three things specifically during a trial. First, confirm the connectors reach your actual stack, AWS, Kubernetes, your CI/CD pipeline, without requiring you to duplicate telemetry into a new system. Second, verify the security model: Opsphere maintains strict read-only access across its more than 300 operational tool integrations, which matters if you are running the Phase 2 read-only pilot described earlier in this guide. Third, check whether the platform produces an actual evidence trace for each diagnosis, not just a confidence score, since that trace is what lets your on-call engineers verify a suggestion instead of blindly trusting it.
Opsphere offers multiple subscription plans including free and paid options, with custom solutions available for larger organizations. Full details are on the pricing page. Start with the Community tier or a Developer plan to run your own read-only pilot against real incident data before committing to a larger rollout.
FAQ
Can AI Do Root Cause Analysis?
Yes. AI systems, ranging from statistical causal graphs to LLM-based reasoning agents, can identify probable root causes by correlating telemetry against service dependency data. Accuracy depends heavily on data quality and evidence grounding, which is why frameworks like eARCO pair AI reasoning with retrieval of similar historical incidents rather than relying on raw model output alone.
What Are the Five Steps of RCA?
Most root cause analysis frameworks follow a similar sequence: define the problem, collect data on what happened, identify possible causal factors, determine the actual root cause through evidence, and implement corrective action to prevent recurrence. Automated RCA systems compress the data collection and causal factor identification steps significantly, since correlation and dependency mapping happen algorithmically rather than manually.
Is RCA Part of Six Sigma?
Root cause analysis is a core technique used within Six Sigma’s DMAIC methodology, particularly in the Analyze phase, but RCA itself is a broader discipline that predates and extends beyond Six Sigma. In software operations, RCA operates independently of Six Sigma, applied directly to incident response and system reliability work.
What Is the Main Difference Between FMEA and RCA?
Failure Mode and Effects Analysis (FMEA) is proactive, predicting how a system might fail before it does, while root cause analysis is reactive, investigating why a failure already happened. Automated RCA tools focus on the reactive side, though the dependency graphs they build can also inform proactive FMEA-style risk assessment.
How Does Opsphere Support Automated Root Cause Analysis?
Opsphere unifies telemetry, dependency mapping, and evidence tracing across your AWS, Kubernetes, and observability tools into a single operational layer, letting engineers investigate incidents with grounded evidence rather than switching between a dozen dashboards. Pricing starts with a free Community tier, with paid plans detailed on the pricing page.
Recommended
This article is provided for general informational purposes only and does not constitute professional, legal, security, or compliance advice. Please evaluate recommendations against your organization’s specific environment and requirements.