
Small SRE Teams: 5–10 Runbooks for AI Observability via Terraform Native
Small SRE Teams: 5–10 Runbooks for AI Observability via Terraform Native
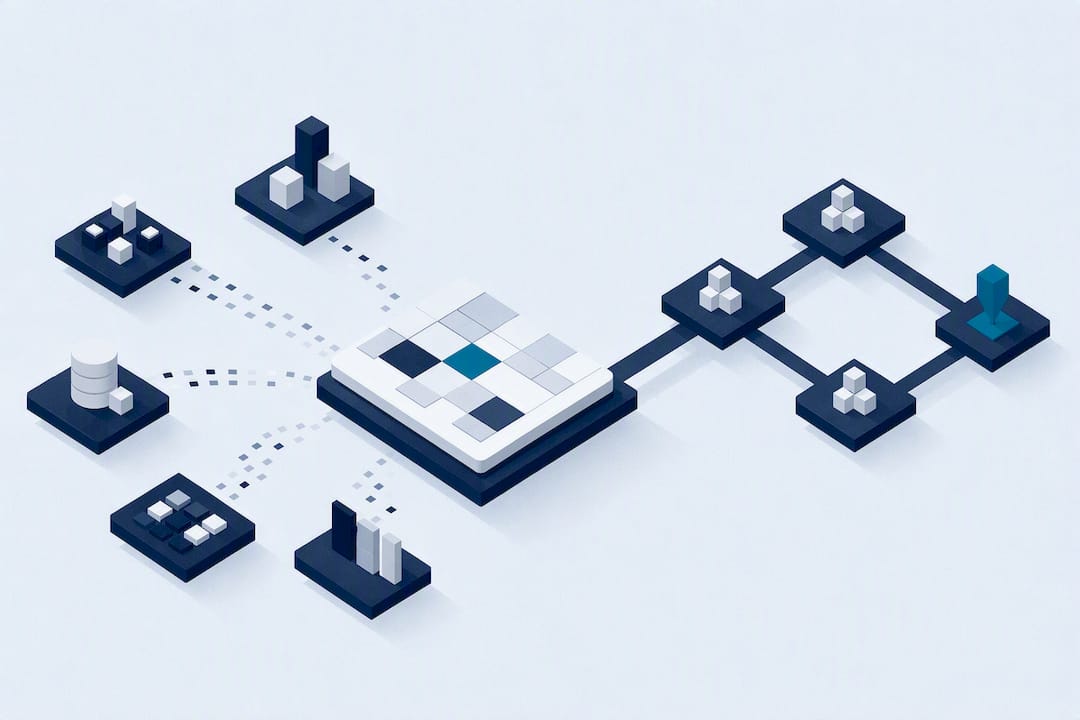
AI observability is an AI-driven operational layer that unifies telemetry from your cloud infrastructure, correlates it against a live service topology, and surfaces evidence-backed root causes instead of raw alerts. For SRE and DevOps teams, that translates into a large drop in alert volume and materially faster incident resolution. Start by connecting one telemetry source, like Kubernetes events or an AWS metrics feed, and the value compounds from there.
TL;DR:
- Deploying AI observability can reduce alert volume by up to 95 percent and decrease mean time to resolution by an average of 40 percent or more.
- Building a unified telemetry system and a live dependency graph is essential to achieve accurate causal reasoning and effective incident analysis.
- Scaling requires keeping the dependency topology current through integration with deployment pipelines and normalizing cross-cloud telemetry formats.
- Incomplete data coverage or faulty telemetry can lead to false confidence and misattributed root causes, especially when automating remediation actions.
- Small teams benefit most by starting with one service, focusing on a few automation targets, and gradually expanding based on clear metrics like alert-to-incident ratio and MTTR.
Table of Contents
- What the Data Shows: Measurable Benefits of AI Observability
- How an AI Operational Layer Reasons About Incidents
- How to Adopt AI Observability in a Small-to-Mid SRE Org
- What AI Observability Can’t Do (and the Risks You Need to Manage)
- The AI/ML Techniques Behind Modern Observability
- Scaling AI Observability Across Complex, Dynamic Environments
- Real-World Patterns From SRE Teams Deploying AI Observability
- Integration Challenges Across Common Observability Stacks
- Security Considerations for AI-Enhanced Observability
- Why This Moment Matters for Small Infrastructure Teams
- How Opsphere Helps You Put This Checklist Into Practice
- Sources
What the Data Shows: Measurable Benefits of AI Observability
The numbers behind AI observability are not marginal. They are the kind of shift that changes how a team staffs on-call.
By the numbers: Teams that deploy AI-driven correlation report alert volume reductions of up to 95%, often moving from 800+ raw alerts a day down to 20 to 50 actionable items. Mean time to resolution drops by an average of 40%, with some organizations reaching 58% within 30 days of implementation.
Those two figures feed each other. Fewer, better-correlated alerts mean engineers spend less time triaging noise and more time on the incident that actually matters, which is exactly why MTTR falls in tandem with alert volume.
The downstream effects show up in places that don’t fit neatly into a dashboard:
- Fewer 3 a.m. pages, because low-signal alerts get suppressed or bundled before they ever reach a human.
- Lower burnout and better retention. Teams that cut noise by more than 90% report higher on-call satisfaction, which matters when experienced SREs are hard to replace.
- More time for reliability engineering instead of firefighting, since engineers aren’t burning hours chasing correlated symptoms of the same root cause.
- A measurable jump in uptime. Faster resolution correlates with a notable increase in availability for revenue-critical systems.
If you want to know whether AI observability is working for your team, track two numbers: your alert-to-incident ratio (how many alerts actually map to a real incident) and MTTR broken out by incident type. A shrinking ratio and a falling MTTR curve are the two clearest signs the operational layer is earning its keep.
How an AI Operational Layer Reasons About Incidents
The architecture behind AI observability comes down to four layers working together, and each one solves a specific failure mode of traditional monitoring.
Unified telemetry ingestion comes first. Metrics, logs, traces, events, and configuration data all get normalized into one system instead of living in five separate tools. This is fundamentally a telemetry integration problem before it’s an AI problem. Without unified signals, no model can reason across silos, no matter how sophisticated it is.
Live service topology is the working graph the model reasons over. It maps which services depend on which, so when a downstream API starts timing out, the system already knows what’s upstream of it, not just what’s alarming.
Correlation versus causation is where most legacy tools stop and where AI observability has to go further. Grouping alerts that fire together is correlation. Explaining why one event caused the next, using dependency modeling and telemetry distillation, is causal reasoning, and it’s the difference between a pile of related alerts and a single evidence-backed root cause chain. Distillation architectures keep the causally relevant signals from petabyte-scale telemetry while trimming the rest, which is what makes this reasoning affordable at production scale.
Agentic workflows close the loop. Once a root cause is identified, agentic AI can group and enrich alerts, draft the incident summary, and propose or execute a remediation step, with a human approval gate on anything that touches production state.
- Metrics, logs, traces, and topology feed one normalized data model.
- A live dependency graph anchors correlation to actual system structure.
- Causal chains replace flat alert lists with a ranked, evidence-backed explanation.
- Agentic remediation runs inside human-in-the-loop guardrails, not full autonomy.
Pro Tip: Don’t wait for perfect data before building your topology graph. Start with your highest-traffic services and their direct dependencies; the graph gets more valuable as you add nodes, but it’s useful from day one.
Opsphere’s platform is built around exactly this sequence: normalize the telemetry, build the topology, then let causal reasoning do the heavy lifting instead of another rules engine.
How to Adopt AI Observability in a Small-to-Mid SRE Org
Rolling this out doesn’t require ripping out your existing stack. It requires sequencing the work correctly.
- Unify your telemetry first. Standardize on OpenTelemetry where you can, and make sure Prometheus metrics, distributed traces, and application logs all land in one place before you worry about AI on top of them.
- Map your dependencies. Build or import a live topology of services, so correlation has something structural to reason against instead of just timestamps.
- Pick 5 to 10 automation candidates. Choose the incidents your on-call rotation resolves most often, document the runbook for each one, and canary it with a read-only dry run before enabling any automated action.
- Integrate with what you already run. Connect cloud provider APIs (AWS, GCP, Azure), Kubernetes, your CI/CD pipeline, and your paging and ticketing tools like Slack and PagerDuty so the operational layer sees deploys, not just symptoms.
- Track rollout metrics before widening scope. Use alert-to-incident ratio, MTTR by incident class, and on-call interruptions per engineer per week as gating criteria before you let automation touch more of your stack.
If you’re already managing infrastructure as code, look for a platform with Terraform-native support, since it keeps the operational layer in sync with how you actually provision and change systems.
What AI Observability Can’t Do (and the Risks You Need to Manage)
AI observability is not a substitute for good telemetry, and it will confidently give you the wrong answer if your data is incomplete. A model can only correlate what it can see, so a service with poor instrumentation produces gaps that show up as silent or misattributed root causes.
The bigger operational risk is false confidence. A causal chain that looks clean but rests on thin evidence can send an on-call engineer down the wrong path just as easily as no alert at all, which is why the platform needs to expose its evidence chain, not just its conclusion.
Agentic remediation raises the stakes further. Any workflow that can take action in production needs canarying, audit logs, and a manual approval gate before it runs unsupervised, because agentic AI adapting to failure modes it wasn’t designed for is a real operational risk, not a theoretical one.
- Poor telemetry coverage produces blind spots the AI can’t reason around.
- Correlation without causal evidence risks misattributing root cause.
- Agentic actions need canary runs, audit trails, and human sign-off gates.
- Token usage and agent cost should be tracked as reliability signals, not just billing line items.
Pro Tip: Treat your AI operational layer’s confidence score the way you’d treat a junior engineer’s hunch: useful input, not a verdict. Always check the evidence chain before approving an automated fix.
The AI/ML Techniques Behind Modern Observability
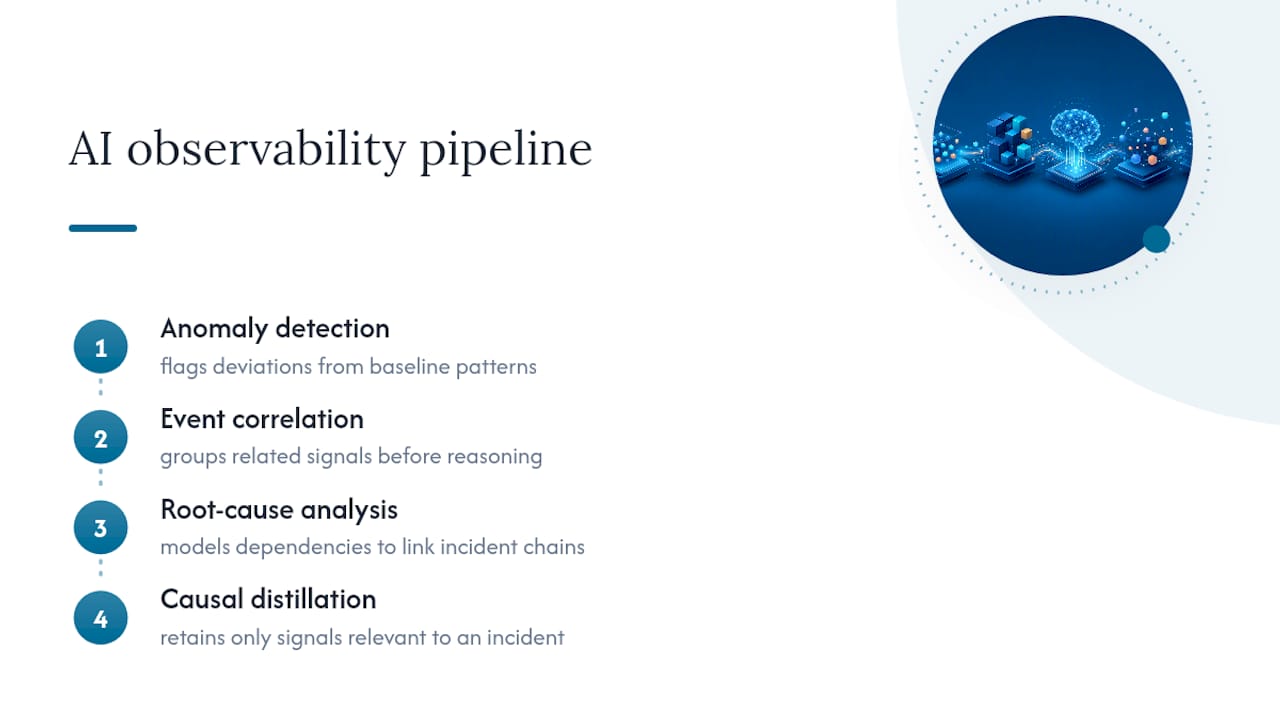
Anomaly detection is the entry point for most AI observability platforms, typically using statistical baselining or unsupervised models to flag metrics that deviate from a service’s normal behavior pattern, rather than relying on static thresholds that break the moment traffic patterns shift. This is what lets a platform catch a slow memory leak or a gradually degrading queue depth that a fixed alert rule would miss entirely.
Root cause analysis algorithms go further by modeling dependencies explicitly. Rather than clustering alerts by time proximity alone, these techniques weight relationships in the service topology, so a database connection pool exhaustion event gets correctly linked to the five downstream services throwing timeout errors, instead of treating all five as independent incidents.
Causal distillation, the practice of keeping only the telemetry signals that matter to a given incident chain, is what makes this tractable at scale. Without it, a platform trying to reason over petabytes of logs and traces either times out or produces answers too slow to be useful during an active incident.
Event correlation engines sit underneath all of this, grouping related signals before causal reasoning even starts. The distinction matters for your evaluation criteria: a platform that only clusters alerts is doing correlation, while one that can trace a specific chain of cause and effect back through your topology is doing something closer to genuine root cause analysis. Ask any vendor which one you’re actually buying.
Scaling AI Observability Across Complex, Dynamic Environments
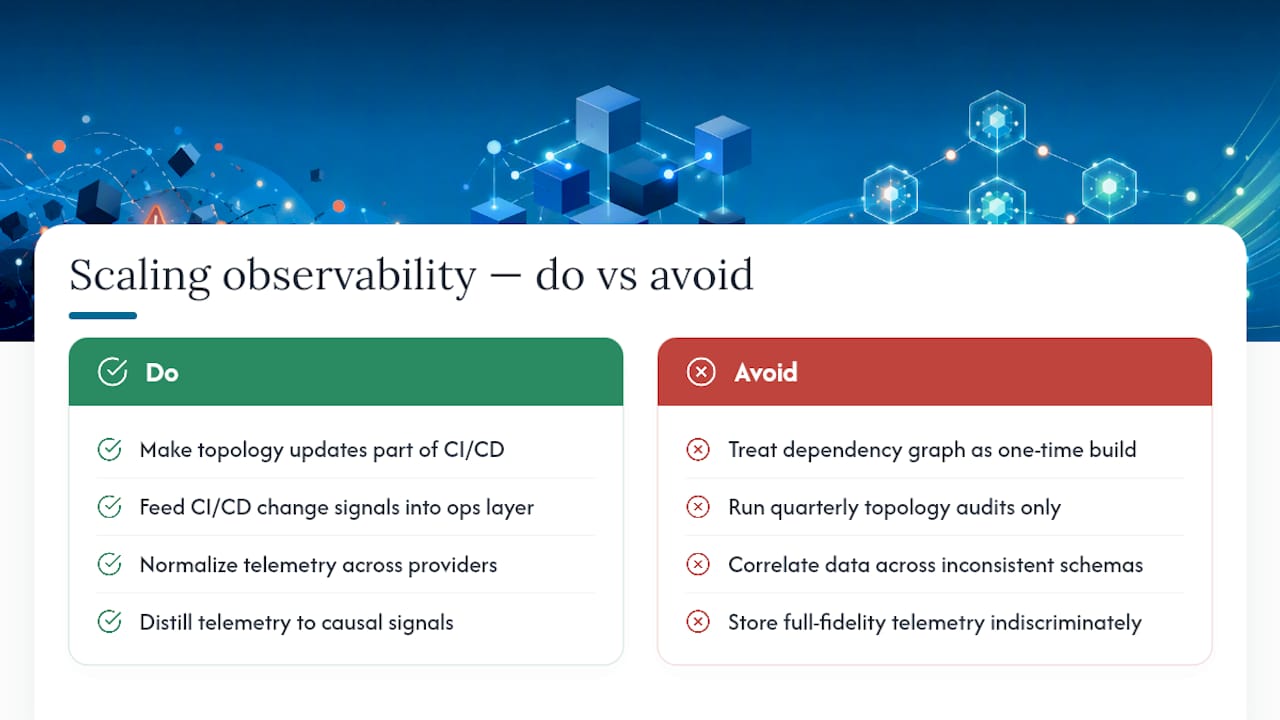
Scaling AI observability past a handful of services is less about adding more AI and more about keeping your topology graph accurate as your architecture changes underneath it. A dependency graph built once during onboarding and never updated becomes actively misleading within a few sprints, especially in microservices environments where services get added, split, or deprecated constantly.
The practical fix is treating topology updates as part of your deployment pipeline, not a quarterly audit. If your CI/CD system already knows what changed, feeding that signal into the operational layer keeps the graph current without manual maintenance.
Multi-cloud and hybrid environments add another layer of complexity, since telemetry formats and naming conventions rarely match across AWS, GCP, Azure, and on-prem systems. Normalizing that data before correlation, rather than trying to reason across inconsistent schemas, is what keeps causal chains accurate as you add providers.
Cost control becomes a real constraint at scale too. Storing and reasoning over full-fidelity telemetry from hundreds of services gets expensive fast, which is why distillation architectures that retain causally relevant signals while discarding the rest matter more as your footprint grows, not less. Teams that skip this step tend to either blow their observability budget or start sampling so aggressively that the AI loses the signal it needs.
Finally, scale means more automation candidates competing for attention. Prioritize by blast radius and frequency, not by what’s easiest to automate first.
Real-World Patterns From SRE Teams Deploying AI Observability
The clearest deployment pattern across SRE teams adopting AI observability starts small and deliberate: one team, one service tier, a handful of automation candidates, before anything gets wired into broader paging logic. Teams that skip this step and try to automate everything at once tend to lose trust in the system the first time it acts on incomplete evidence.
The teams seeing the strongest results are the ones that treat their alert-to-incident ratio as a live health metric for the rollout itself, not just an outcome to report later. When that ratio doesn’t improve within the first few weeks, it’s usually a sign the topology graph is incomplete, not that the AI layer is failing.
A recurring pattern among small SRE teams specifically: the biggest win isn’t the automated remediation, it’s the evidence chain that turns a 2 a.m. page into a five-minute diagnosis instead of a 45-minute investigation across four separate dashboards. That time back is what teams cite most often when asked what changed after adoption. Small SRE teams in particular report that consolidating tool sprawl into one operational view, rather than adding another dashboard to check, is what actually changes on-call behavior.
The failure pattern is just as consistent: teams that bolt AI correlation onto fragmented, poorly instrumented telemetry get noisier output, not cleaner signal. The AI amplifies whatever quality of data it’s given.
Integration Challenges Across Common Observability Stacks
The most common integration friction isn’t the AI layer itself, it’s getting existing tools to agree on what a service even is. Prometheus, Kubernetes, cloud-native logging, and third-party APM tools each have their own naming and tagging conventions, and reconciling them is where most rollouts stall.
OpenTelemetry helps standardize the instrumentation layer, but adopting it doesn’t automatically fix inconsistent service naming across teams that set up their own dashboards years ago. Budget real time for a normalization pass before you expect clean correlation.
Kubernetes environments bring a specific wrinkle: ephemeral pods and constantly changing IPs mean topology mapping needs to key off service and deployment identity, not network addresses, or the dependency graph goes stale within hours.
CI/CD integration is frequently underestimated. If your operational layer doesn’t know when a deploy happened, it will correctly identify a spike in errors but miss the most useful causal signal: that it started three minutes after a release. Wiring deploy events into your telemetry pipeline early solves a disproportionate number of “mystery” incidents.
Paging and ticketing integrations (Slack, PagerDuty, Jira) tend to be the easiest technical lift and the easiest to get wrong politically. Decide up front which alerts route to which on-call rotation before automation starts consolidating them, or you’ll spend your first month renegotiating ownership boundaries instead of tuning the model.
Security Considerations for AI-Enhanced Observability
AI observability platforms get broad read access across your infrastructure by design, which makes them a high-value target if credentials are compromised. Scope API keys and service accounts to the minimum access needed, and rotate them on the same schedule you’d apply to any other system with cross-environment visibility.
Agentic remediation raises the stakes further, since a system that can act on production infrastructure needs the same access controls you’d apply to a human on-call engineer: least privilege, audit logging on every action, and a clear rollback path. Google’s SRE team frames this as adapting runbooks and paging logic specifically for agent-driven failure modes, not just extending human runbooks to cover AI actions.
Instrumenting the decision layer itself matters for security, not just debugging. Capturing tool inputs, intermediate outputs, and token usage as first-class telemetry means you have an audit trail if an agent takes an unexpected action, rather than reconstructing what happened after the fact from partial logs.
Data residency and retention also need attention, since consolidating telemetry from multiple clouds into one platform means sensitive data (customer identifiers in logs, internal API structures) now lives in one place. Review what gets ingested and how long it’s retained before you connect production systems, and treat that review as part of onboarding, not an afterthought.
Why This Moment Matters for Small Infrastructure Teams
Most of the AI observability conversation gets framed around enterprises with dozens of SRE hires and dedicated platform teams. That framing misses where the technology actually changes daily work the most: small teams where one or two engineers cover incident response across a sprawling stack of AWS services, Kubernetes clusters, and third-party integrations, with no bandwidth to build custom tooling.
Opsphere’s unified operational layer exists for exactly that gap. It normalizes signals from tools like AWS and Kubernetes into one coherent view, and its Terraform-native approach means the platform stays aligned with infrastructure as it’s actually provisioned, not a static snapshot from onboarding day. That data normalization is what separates a genuine operational layer from another dashboard layered on top of existing tool sprawl.
The teams best positioned to benefit are the ones drowning in tool switching, not the ones lacking data. If that’s your team, the checklist above is your starting point.
— José
How Opsphere Helps You Put This Checklist Into Practice
This operational layer is built for exactly the rollout sequence described above. Instead of adding another dashboard to your stack, it normalizes signals from cloud providers, Kubernetes, and existing DevOps tools into one coherent view, so the unification step in your adoption checklist happens by design, not by manual data wrangling.
A few ways it maps directly to what you just read:
- Unified telemetry ingestion across cloud providers and Kubernetes, without the tool-sprawl overhead of maintaining five separate dashboards.
- Causal insight, not just correlation, so incidents surface with an evidence-backed root cause instead of a list of related alerts.
- Runbook automation with human-in-loop controls, built to match the canary-then-approve rollout pattern that keeps automation safe.
- Terraform-native integration, so your topology graph stays accurate as infrastructure changes, which matters most for teams managing infrastructure as code.
The fastest way to see whether this fits your stack is to connect one data source and watch your alert-to-incident ratio for a week. Explore the Opsphere platform or start with a single integration to see what your team’s telemetry looks like once it’s actually unified.
Sources
- The end of alert fatigue: how AI-powered observability is transforming SRE teams in 2026
- Why observability can’t keep up with AI complexity
- How Google SRE is using agentic AI to improve operations