
8 Steps to Observability for SREs: OpenTelemetry, Cardinality, Sampling
8 Steps to Observability for SREs: OpenTelemetry, Cardinality, Sampling
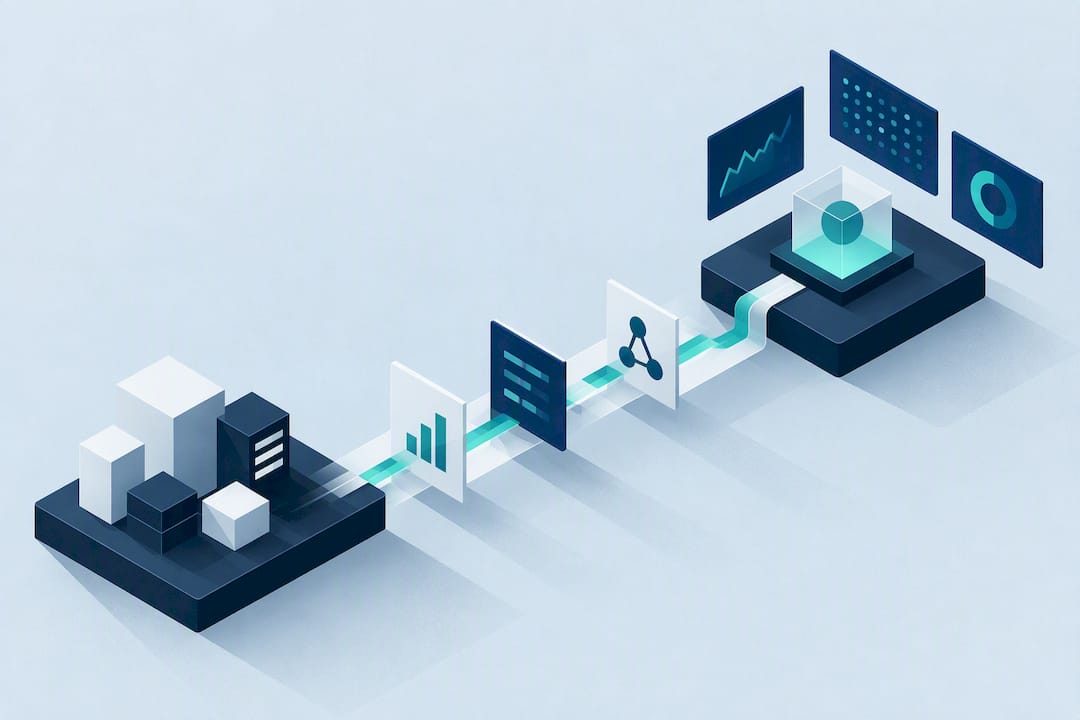
Observability is a system’s property of exposing enough telemetry, metrics, logs, and traces, to let you infer its internal state from outside without prior knowledge of the failure mode. It matters because modern distributed systems fail in ways no dashboard predicted in advance, and observability is what lets you find root cause anyway. If you’re starting from zero, the first move is simple: audit your instrumentation and make sure every request carries a stable correlation ID, ideally through OpenTelemetry.
TL;DR:
- Tagging high-cardinality fields like user or request IDs should be limited to avoid exponential costs in index size and query complexity.
- High-cardinality data enables detailed filtering and slicing during investigations, making it essential for root cause analysis in distributed systems.
- Effective instrumentation requires establishing consistent semantic conventions and robust context propagation to ensure trace continuity across services.
- Combining metrics, logs, and traces allows you to infer internal system states and troubleshoot unforeseen failures without prior prediction.
- AI tools aid in anomaly detection and alert correlation but depend on high-quality telemetry, which remains the primary challenge for scaling observability efforts.
Table of Contents
- What Does Observability Actually Mean?
- The Three Pillars: Metrics, Logs, Traces, and Cardinality
- How Does Observability Work in Practice?
- Observability vs Monitoring: What’s the Real Difference?
- Why Observability Matters: Real Benefits and Use Cases
- How to Implement Observability: A Practical Checklist
- Challenges and Best Practices for Scaling Observability
- What Role Does AI Play in Observability?
- How an Operational Intelligence Layer Supports Observability
- Ready to Unify Your Observability Investigations?
- Sources
- FAQ
What Does Observability Actually Mean?
The term didn’t originate in software. Engineer Rudolf Kálmán defined observability in 1960 as a property of control systems: whether you can determine a system’s internal state purely from its external outputs. That framing translates almost directly into distributed systems. Your services are the system, your telemetry is the output, and observability is your ability to reconstruct what happened inside a request path using only what it emitted.
This distinction matters more than it sounds. A system is observable) when you can answer a new question about production behavior without shipping new code or guessing in advance what might break. That’s the entire point: reducing how much prior knowledge you need before you can debug something.
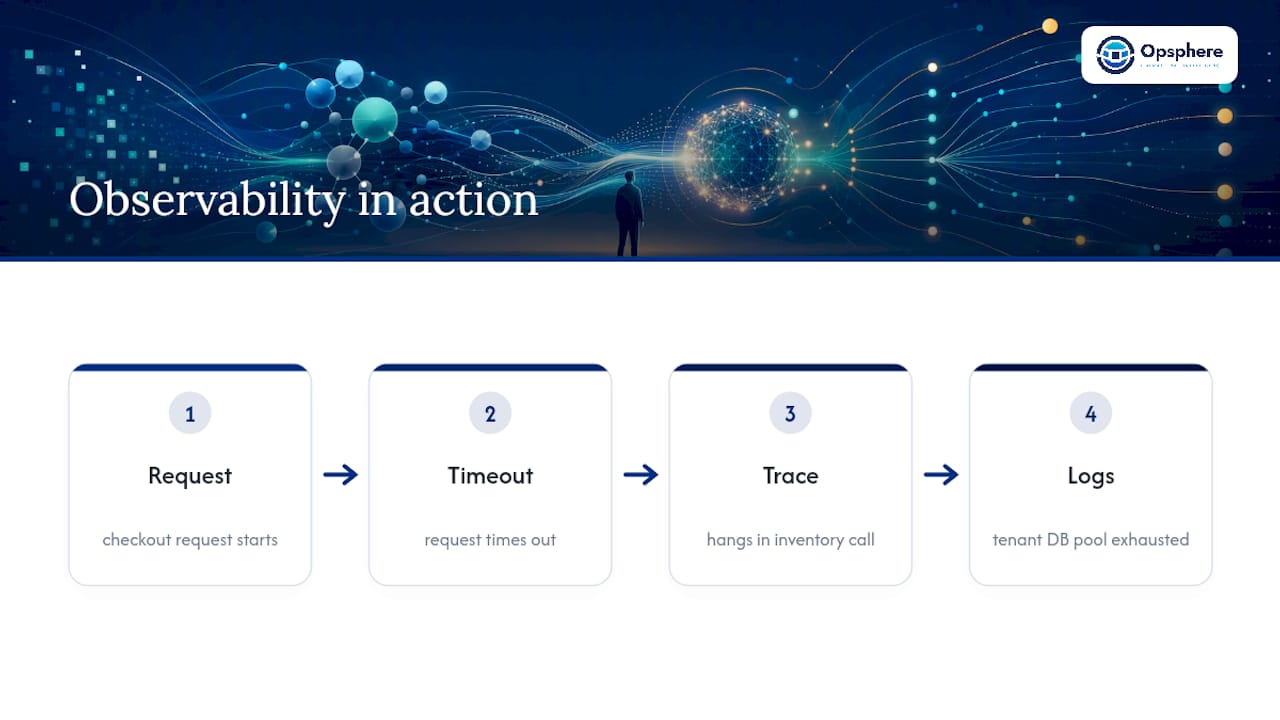
Here’s what that looks like in practice, incorporating best practices from the authoritative AI Agent Monitoring: A Production Guide for IT Leaders to enhance reliability. A checkout service starts timing out for a subset of users. There’s no alert for this specific failure because nobody predicted it. A trace shows the request hanging inside a downstream inventory call. The logs on that span reveal a retry loop against a database connection pool that’s exhausted for one tenant. No dashboard was built for “tenant-specific connection pool exhaustion.” The telemetry made it discoverable anyway.
Observability is the ability to infer the internal state of a complex system from its external outputs, without needing to have anticipated the specific failure in advance. That’s what separates it from a system that simply reports metrics you already thought to track.
That inference capability is why observability keeps paying off as systems get more distributed. Every new microservice, every new failure mode, every unknown unknown adds a reason you can’t pre build every dashboard you’ll ever need.
The Three Pillars: Metrics, Logs, Traces, and Cardinality
Every observability strategy rests on three telemetry signals, and each answers a different question.
- Metrics are numeric aggregates over time, like request rate, error percentage, or CPU usage. They’re cheap to store and great for trends, but they compress away detail.
- Logs are discrete, timestamped records of events. They carry rich context but get expensive and noisy at scale if unstructured.
- Traces follow a single request across every service it touches, showing latency and errors at each hop. They’re what makes distributed failures legible.
The signal that ties all three together is cardinality. A field like status_code has low cardinality, maybe five or six values. A field like user_id, request_id, or tenant_id has extremely high cardinality, potentially millions of unique values. Traditional monitoring tools choke on high-cardinality data because they were built to aggregate, not to filter and slice arbitrarily. Observability tooling is built to do the opposite: let you ask “show me every request from tenant_id=8842 that touched region=us-east-1 and had latency over 800ms,” on the fly, without a prebuilt query.
Cardinality is the real cost driver. Every unique combination of high-cardinality fields multiplies the index size in most backends, which is why sampling and retention decisions later in this guide matter as much as instrumentation itself.
Beyond the three core signals, mature observability setups also track profiling data (where CPU and memory actually go inside a process), service topology and dependency maps (what calls what), and structured events (deployments, config changes, feature flag flips) that correlate with incident timelines. The instrumentation layer that ties all of this together, across languages and vendors, is OpenTelemetry, now the default choice for teams that don’t want to re-instrument every time they switch backends.
How Does Observability Work in Practice?
Observability starts with instrumentation, the code inside your services that emits metrics, logs, and traces. Getting this right depends on consistency, not cleverness.
Semantic conventions matter more than most teams initially expect. If one service calls it http.status_code and another calls it httpStatusCode, you lose the ability to correlate across them at query time. OpenTelemetry’s semantic conventions exist specifically to prevent that kind of fragmentation, and adopting them early saves painful schema migrations later.
Context propagation is the second pillar of working instrumentation. Every request needs a trace ID that travels with it through every hop, every queue, every async job, so a support ticket or an alert can be traced back to the exact span where things went wrong.
Once telemetry is emitted, it flows through a pipeline with three jobs:
- Collectors receive raw telemetry from every service, often via the OpenTelemetry Collector, which normalizes formats before anything else happens.
- Processors enrich, filter, and sometimes sample that data, adding metadata like deployment version or cluster name.
- Exporters route the processed telemetry to one or more storage backends, whether that’s a hosted platform or a self-managed stack.
The choice between hosted and self-managed backends usually comes down to operational bandwidth. Hosted platforms remove the burden of running storage and indexing at scale; self-managed stacks give you more control over retention and cost, at the price of running that infrastructure yourself.
Sampling is where most of the hard trade-offs live. Head-based sampling decides whether to keep a trace before you know if it’s interesting, which is fast but risks throwing away the exact rare error you needed. Tail-based sampling waits until the trace completes, then keeps it based on latency or error status, which preserves more signal but costs more to run.
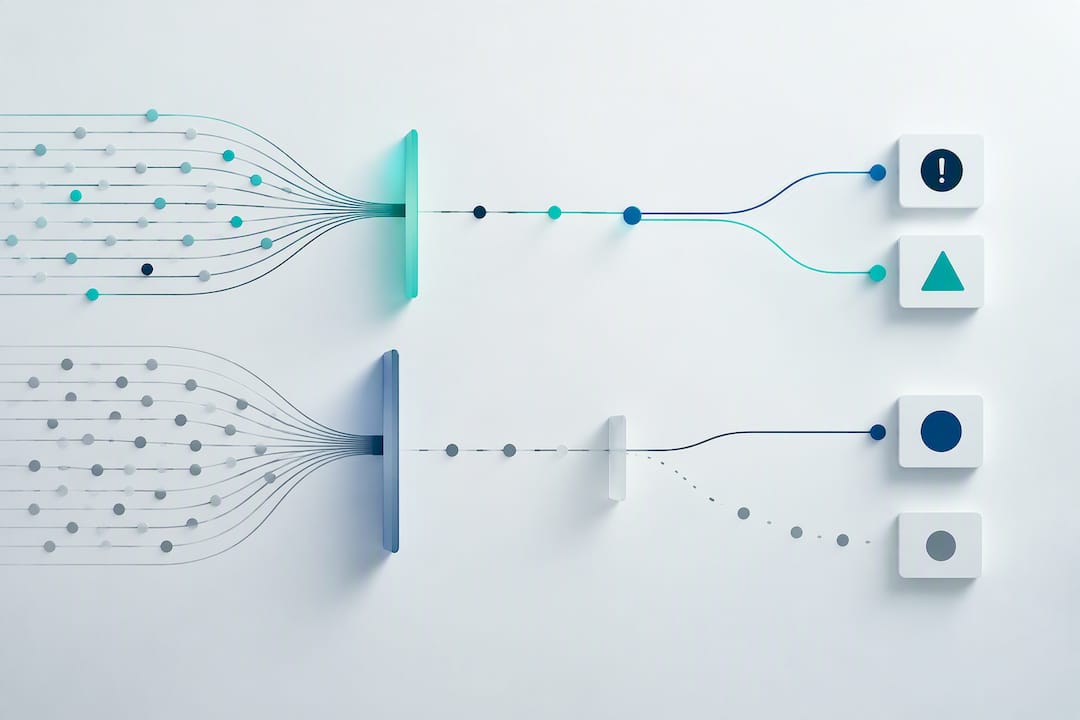
Pro Tip: Never sample uniformly across all traffic. Keep 100% of error traces and slow traces, and sample the boring, fast, successful ones aggressively. You lose almost nothing and cut storage costs dramatically.
Storage design follows the same logic: hot storage for the last few days of high-resolution data, cold or aggregated storage for anything older, driven by retention and cost trade-offs you set deliberately rather than by default settings.
Observability vs Monitoring: What’s the Real Difference?
Monitoring tells you what is broken. Observability helps you figure out why. That’s the entire distinction, and it’s worth being precise about it because the two terms get used interchangeably in ways that cause real confusion on call rotations.
Monitoring is built around known unknowns: predefined thresholds, health checks, and alerts for failure modes someone already anticipated. Disk usage over 90%. Error rate above 2%. Monitoring is essential and it should stay in place. But it only catches what it was configured to catch.
Observability is built around unknown unknowns. It gives you the exploratory tools to ask a new question about a problem nobody wrote an alert for.
Picture a real incident:
- Monitoring path: An alert fires because p99 latency crossed 2 seconds on the checkout service. That’s all the alert tells you.
- Observability path: You pull the traces tagged with that latency spike, filter by
regionandcustomer_tier, and discover the slowdown only hits enterprise tenants routed through a specific database shard added last week.
The alert told you something was wrong. The exploration told you why, and where to fix it. In a healthy setup, the monitoring alert is the trigger, and the investigation that follows is where observability tooling, not the alert itself, does the real work.
Why Observability Matters: Real Benefits and Use Cases
The value shows up fastest in incident response. Teams with strong tracing and high-cardinality telemetry cut the time between “something’s wrong” and “here’s the root cause,” which shortens mean time to resolution directly.
- Faster root-cause analysis because engineers can query traces and logs instead of guessing from aggregate dashboards.
- Better user experience management, since you can tie SLA violations to specific customer segments, regions, or code paths instead of averages that hide the worst experiences.
- Security forensics, where high-cardinality logs and traces let responders reconstruct exactly what an attacker touched, in what order, across which services.
- Faster developer feedback loops, since traces from staging and canary deployments surface regressions before they reach every user.
The core shift is architectural, not tooling. Cloud-native systems built on microservices and containers fail in distributed, non-deterministic ways that a handful of static dashboards were never designed to catch. That’s the actual reason observability adoption has scaled alongside Kubernetes and service-mesh architectures rather than staying a niche practice.
How to Implement Observability: A Practical Checklist
Rolling out observability across an organization works best as a staged effort, not a rip-and-replace project.
- Start with your highest-risk services. Pick the two or three services where an outage causes the most customer or revenue impact, and instrument those first.
- Define your telemetry schema before you write code. Decide which fields are mandatory on every span and log line, like
request_id,tenant_id, andservice_version, so correlation works from day one. - Adopt OpenTelemetry and its semantic conventions. This keeps your instrumentation portable if you switch backends later, and avoids the schema drift that makes cross-service queries unreliable.
- Standardize context propagation. Every trace ID needs to survive across service boundaries, queues, and async jobs, or your traces will have gaps exactly where debugging matters most.
- Design your pipeline deliberately. Decide where collectors sit, what enrichment happens in processors, and which exporters route data to which backend, rather than defaulting to whatever your first tool assumed.
- Set sampling and retention policy explicitly. Keep all error and slow-request traces; sample the rest based on what your budget and query needs actually require.
- Put cost guardrails and access controls in place before scaling out. High-cardinality data is powerful and expensive; decide who can query what, and cap index growth before it surprises your finance team.
- Write runbooks for exploratory debugging, not just for known alerts. A runbook that says “check this dashboard” is monitoring. A runbook that says “here’s how to slice traces by tenant and region when latency spikes” is observability.
Pro Tip: Roll out the schema and semantic conventions organization-wide before you roll out full instrumentation coverage. Retrofitting field names across fifty services later costs far more engineering time than agreeing on them up front.
Teams juggling telemetry from AWS, Kubernetes, CI/CD, and security tools often find the real bottleneck isn’t collecting data, it’s correlating it fast enough during an incident. A unified operational layer that sits across those sources can shorten that step considerably.
Challenges and Best Practices for Scaling Observability
Cardinality is the challenge every team eventually runs into. Left unmanaged, tagging every span with unbounded fields (raw user input, full URLs with query strings) causes indexing costs to grow faster than your traffic does. The fix is deliberate: cap cardinality on fields that don’t need to be infinite, and reserve genuinely high-cardinality tagging for fields you’ll actually query during investigations, like tenant_id or request_id.
Alert fatigue is the second recurring failure. Correlating related alerts into a single incident, instead of paging on every downstream symptom, keeps signal-to-noise high enough that engineers still trust the pager at 3 a.m.
Schema drift creeps in as services evolve independently. Without governance, one team renames a field and breaks cross-service correlation silently. Regular schema audits and shared semantic conventions prevent this from compounding.
Telemetry also carries real privacy and security weight. Logs and traces routinely capture user identifiers, IP addresses, and sometimes accidental PII in error messages, which means access controls and redaction policies belong in your pipeline design, not as an afterthought.
| Challenge | Practical fix |
|---|---|
| Runaway cardinality costs | Cap unbounded fields; reserve high-cardinality tags for fields you’ll actually query |
| Alert fatigue | Correlate related alerts into single incidents instead of paging per symptom |
| Schema drift across services | Shared semantic conventions with periodic audits |
| Telemetry privacy exposure | Redaction policies and access controls built into the pipeline |
What Role Does AI Play in Observability?
AIOps tools add real value in narrow, specific ways: anomaly detection across metrics that would take a human hours to notice, alert correlation that groups symptoms into one incident, and dependency-impact analysis that shows which downstream services a failing one affects.
The limits are just as real. AI models drift as your systems change, they generate false positives when training data doesn’t match current traffic patterns, and they lack the contextual judgment a human investigator brings to an ambiguous trace. AIOps augments investigation; it doesn’t replace the need for explorable, high-quality telemetry underneath it.
- AI is strongest at surfacing anomalies and correlating noisy alerts, weakest at judging business context.
- Model drift means AIOps tooling needs retraining or retuning as your architecture evolves.
- Good telemetry, not a smarter model, remains the actual bottleneck for most teams.
How an Operational Intelligence Layer Supports Observability
Correlating telemetry across AWS, Kubernetes, CI/CD, and security tooling is where most investigations lose time, not in collecting the data itself. Opsphere approaches this by connecting to your existing tools without replacing them, keeping each system as the source of truth while unifying the operational context around an incident.
- AI Agents and Model Context Protocol work across more than 300 read-only tools, letting engineers query infrastructure and telemetry context from one interface during triage.
- Structured, evidence-backed investigation supports testing multiple hypotheses in parallel instead of chasing one theory at a time.
- Strict read-only access and governance controls keep security and compliance requirements intact while still giving teams unified visibility.
- Terraform-native support fits infrastructure-as-code workflows that many platform teams already run on.
Ready to Unify Your Observability Investigations?
If your team is stitching together dashboards from five different tools every time an incident hits, the bottleneck usually isn’t your telemetry, it’s the time spent hopping between systems to correlate it. Opsphere connects to the observability, cloud, and CI/CD tools you already run, without duplicating telemetry or forcing a rip-and-replace migration, and gives investigators a single place to test hypotheses against real operational context.
That’s the practical difference: instead of manually cross-referencing AWS, Kubernetes, and your observability backend during a 2 a.m. page, you get structured investigation with context memory built in, while each connected tool stays the source of truth for its own data. Opsphere’s Developer plan starts at €19 per month, with Team and Enterprise tiers available for larger organizations, along with a Community tier that is offered without charge for teams that want to try the workflow first.
If you’re currently running an instrumentation audit or evaluating your telemetry stack, that’s the right moment to check whether a unified operational layer fits your investigation workflow. Review the pricing page and start with the tier that matches your team’s size.
Sources
FAQ
What Is Observability in Simple Terms?
Observability is the ability to figure out what’s happening inside a system just by looking at what it outputs, its metrics, logs, and traces, without having predicted the specific problem in advance. It comes from control theory, where it originally described whether you could infer a system’s internal state from its external signals.
Is Observability the Same as Monitoring?
No. Monitoring checks for known failure modes using predefined alerts, while observability lets you explore telemetry to answer new questions about problems nobody anticipated. Most teams need both, monitoring to catch the expected, observability to investigate the unexpected.
What Are the Three Pillars of Observability?
The three pillars are metrics, logs, and traces. Metrics show numeric trends over time, logs capture discrete events with context, and traces follow a single request across every service it touches, and high-cardinality fields like request_id are what make all three queryable during a real investigation.
Why Is OpenTelemetry Important for Observability?
OpenTelemetry is the vendor-neutral, industry-standard framework for instrumenting applications to emit metrics, logs, and traces. It lets teams change telemetry backends without re-instrumenting every service, which reduces vendor lock-in significantly.
How Much Does an Observability Platform Like Opsphere Cost?
Opsphere’s Developer plan is €19 per month, with Team and Enterprise tiers priced separately, and a Community tier available at no cost. Custom Solutions pricing is available on request for larger deployments.
Recommended
This article is provided for general informational purposes only and does not constitute professional, legal, security, or compliance advice. Please evaluate recommendations against your organization’s specific environment and requirements.