
Pilot Unified Observability in Weeks for SREs with Opsphere
Pilot Unified Observability in Weeks for SREs with Opsphere

Unified observability means correlating metrics, logs, traces, and events under consistent metadata so engineers can move from symptom to root cause without switching tools or losing context. The primary payoff is faster root cause analysis and a shift from reactive firefighting to predictive detection of failures before users notice. The first practical move is narrow: pick one critical user journey, define a service level objective for it, and instrument that path end to end with OpenTelemetry before expanding further.
TL;DR:
- Successful implementation starts with instrumenting one critical user journey using OpenTelemetry and defining clear service level objectives for accurate measurement.
- Correlating metrics, logs, traces, and events under shared identifiers allows engineers to quickly trace anomalies back to specific root causes, reducing incident resolution time.
- Controlling label cardinality and applying tiered retention are essential to manage storage costs and prevent budget overruns during scaling.
- Alerting based on state transitions rather than raw thresholds improves noise reduction and ensures actionable notifications, with ownership assigned to prevent alert fatigue.
- Integrating AI tools for anomaly detection, log summarization, and causal inference enhances proactive operations but requires human oversight and audit logging for safety.
Table of Contents
- What unified observability means: signals and correlation
- Why unified observability matters: measurable operational outcomes
- Core architecture: ingestion, processing, storage, and alerting
- How to roll out unified observability across cloud and hybrid environments
- Operational practices: SLOs, alert governance, and cost controls
- AI and automation opportunities and guardrails
- Benefits of unified observability over siloed monitoring
- Challenges and common pitfalls in adopting unified observability
- Use cases and industry examples
- Security and compliance considerations for telemetry data
- Opsphere: the operational intelligence layer for unified telemetry
- Sources
- FAQ
What unified observability means: signals and correlation
Traditional monitoring watches individual systems in isolation. A CPU dashboard tells you a host is under load; a separate log viewer tells you an error spiked; neither tells you are the same incident. Unified observability closes that gap by correlating four signal types under shared identifiers, so an engineer can jump from a dashboard anomaly straight to the exact trace and log lines that explain it.
The four building blocks:
- Metrics — numeric time series (latency, error rate, saturation) that show that something changed.
- Logs — structured or unstructured event records that show what happened at a specific moment.
- Traces — request paths across services that show where time was spent and which hop failed.
- Events — discrete state changes (deployments, config pushes, autoscaling actions) that provide the “what changed” context around an incident.
Correlation IDs and consistent metadata tie these together. When every service tags requests with the same trace ID and applies the same label schema (service name, environment, region, version), you can pivot from a spike on a graph to the exact trace, then to the exact log line, in seconds rather than in a scavenger hunt across five tools.
Why unified observability matters: measurable operational outcomes
Correlated telemetry shortens the investigation phase of an incident, which is usually the largest chunk of mean time to resolution. When a dashboard anomaly links directly to the offending trace and its logs, responders skip the manual cross-referencing that eats up the first twenty minutes of most incidents.
Unified observability also enables prediction rather than pure reaction. Anomaly detection running across correlated signals can flag a degrading dependency before it breaches a threshold, giving on-call engineers a warning instead of a page after the customers have already noticed.
The consensus signal: Azure’s Well-Architected Framework frames observability explicitly as a design decision, not a bolt-on tool purchase. It recommends dashboards built around health models and alerting tied to state transitions, not raw threshold crossings, because raw thresholds generate noise while state transitions generate signal.
Beyond MTTR, consolidation pays off in less obvious ways:
- Fewer standalone tools means fewer licenses, fewer integration points, and less time spent reconciling data between them.
- Shared context between SRE, platform, and application teams reduces the “it’s not my dashboard” friction that stalls incident response.
- New hires ramp faster when there is one investigation path (dashboard → trace → log) instead of five tribal workflows.
Core architecture: ingestion, processing, storage, and alerting
A unified observability stack has five layers, and most implementation mistakes happen at the seams between them, not inside any single layer.
Ingestion and collectors. OpenTelemetry has become the default instrumentation standard because it gives you vendor-neutral metrics, traces, and logs from one SDK. The practical decision is agent versus sidecar: agents (like a Collector running as a DaemonSet) suit Kubernetes clusters with many short-lived pods, while sidecars fit environments where per-service isolation and independent scaling matter more than resource overhead.
Processing and enrichment. This is where label design either saves you or buries you. Attach service name, environment, and version consistently at the point of emission, propagate trace context across service boundaries, and apply sampling before data hits expensive storage, not after.
Storage and query. Metrics, logs, and traces have different access patterns and rarely belong in one database. Prometheus-style metrics collection works well for short-term high-resolution data, with Thanos or a similar layer handling multi-cluster federation and long-term retention. Logs benefit from label-based indexing (a Grafana Loki pattern) that keeps storage costs down by avoiding full-text indexing of every line.
Investigation flow. The value shows up in the pivot: a dashboard anomaly links to the specific trace, which links to the exact log lines for that request. If that link breaks anywhere, engineers fall back to manual searching.
Alerting pipeline. Alerts should fire on health-state transitions and route into ticketing or ChatOps automation with clear ownership, not just land in a shared channel everyone ignores.
How to roll out unified observability across cloud and hybrid environments
Rolling out unified observability across a mixed estate works best as a narrow pilot that expands by pattern, not a big-bang platform migration. Here is the sequence that keeps risk low while building organizational trust in the new stack.
- Start with one journey. Choose a single critical user flow, like checkout or login, and define an SLO for it based on latency and error rate. Trying to instrument everything at once guarantees you instrument nothing well.
- Instrument with OpenTelemetry. Standardize on OpenTelemetry SDKs and Collector configuration, and lock down a shared labeling convention for service name, environment, and correlation IDs before writing more code.
- Collect metrics and centralize logs. Deploy Prometheus-style scraping for metrics and route logs into a central pipeline with label-based indexing, so the two systems share the same tags from day one.
- Scale the pipeline deliberately. Add tail-based or head-based sampling to control trace volume, buffer at the Collector to survive backend outages, and set tiered retention (hot, warm, cold) so storage costs scale with actual query needs rather than growing unbounded.
- Operationalize it. Connect every alert to a runbook, assign explicit ownership per service, and only then expand instrumentation to the next journey using the same standards.
Pro Tip: Resist the urge to onboard every team in week one. A single well-instrumented journey that responders trust is worth more than ten half-instrumented services nobody checks during an incident.
Practical rollout advice backs this sequencing: begin with one service, measure whether the new signals actually help responders resolve incidents faster, then expand through version-controlled standards instead of ad hoc dashboard edits.
Operational practices: SLOs, alert governance, and cost controls
Instrumentation without operational discipline just produces more data to ignore. Three practices separate teams that get value from unified observability from teams that drown in it.
Map SLOs to the four golden signals (latency, traffic, errors, saturation) plus at least one business KPI, like completed checkouts per minute. This keeps your alerting tied to what users actually experience, not just infrastructure health.
Alert on state transitions, not raw thresholds. A service crossing from “healthy” to “degraded” is a signal worth waking someone up for. Every alert needs a named owner; unowned alerts get muted within a month.
Treat configuration as code. GitOps for dashboards, alert rules, and Collector pipelines prevents the quiet drift that happens when three engineers each tweak the same alert threshold in the UI over six months.
- Set cardinality limits on metric labels to stop unbounded label combinations from exploding storage costs.
- Apply tiered retention: full resolution for 7 to 14 days, downsampled data for months, aggregates beyond that.
- Use sampling strategically on traces rather than dropping data indiscriminately across the board.
Pro Tip: Cardinality explosions are the single most common reason observability bills triple overnight. Audit label combinations before you scale ingestion, not after the invoice arrives.
AI and automation opportunities and guardrails
AI adds the most value in unified observability when it reduces manual triage time, not when it replaces human judgment on high-risk actions. Practical use cases include anomaly detection across correlated signals, automated log summarization during an active incident, causal inference that narrows down likely root causes from a dependency graph, and adaptive thresholds that adjust to seasonal traffic patterns instead of static limits.
None of that works safely without guardrails. Azure’s Well-Architected guidance is explicit that AI-driven recommendations need human-in-loop review, audit logging, and rollback paths before touching production.
- Use AI to summarize and suggest, not to auto-remediate anything with customer-facing blast radius.
- Log every AI-suggested action for later audit, whether or not an engineer accepted it.
- Test automated runbook suggestions in staging before trusting them in an active incident.
Benefits of unified observability over siloed monitoring
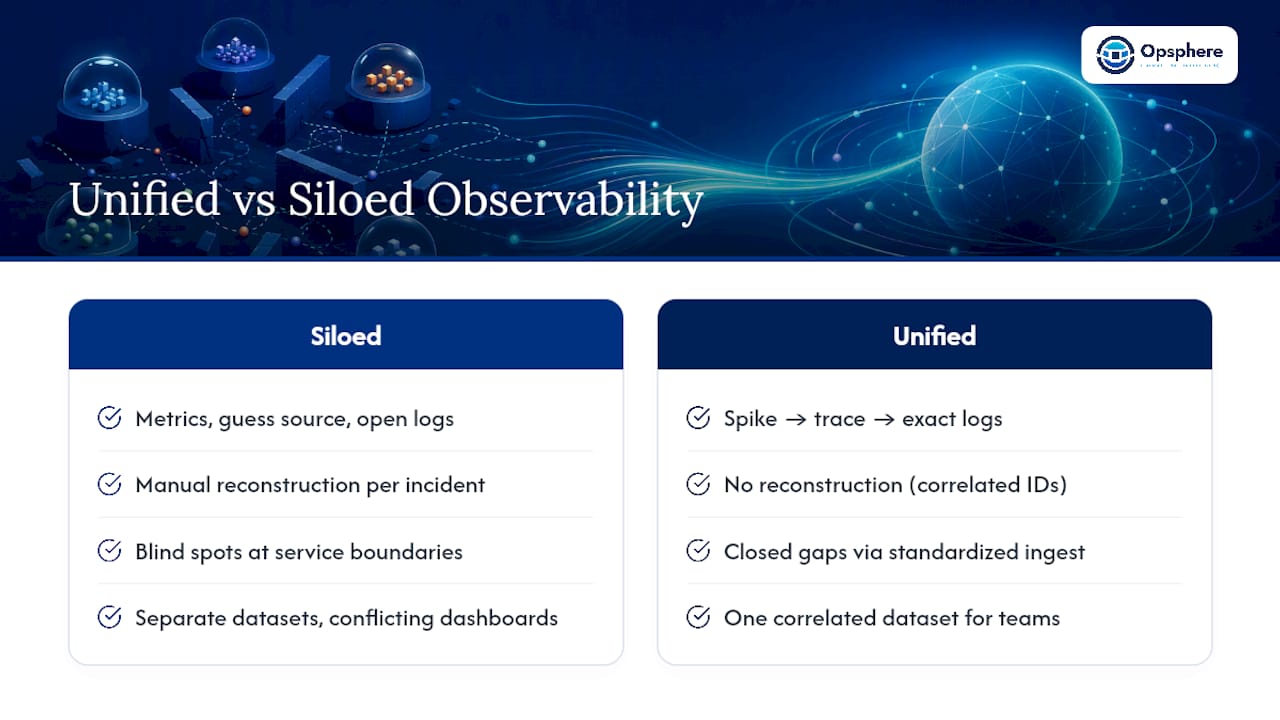
Siloed monitoring forces engineers to context-switch between a metrics dashboard, a log viewer, and a tracing tool, reconstructing the incident timeline by hand each time. Unified observability removes that reconstruction step because the systems already share correlation IDs and labels.
The difference shows up most clearly during multi-service incidents. In a siloed setup, an engineer sees a latency spike, then has to guess which service caused it, open a separate log tool, search by rough timestamp, and hope the right entries surface. In a correlated setup, the same engineer clicks from the spike straight into the trace that shows which downstream call failed, then into the exact log lines tied to that trace ID.
Siloed tools also create data blind spots at the boundaries. A metrics platform that doesn’t talk to your tracing backend can’t tell you why latency increased, only that it did. Unified observability closes that gap by design, since ingestion and labeling are standardized from the start rather than reconciled after the fact.
There’s an organizational benefit too. When SRE, platform, and application teams all query the same correlated dataset, arguments over “whose dashboard is right” mostly disappear. Everyone is looking at the same trace, the same log lines, the same SLO burn rate. That shared context speeds up incident reviews as much as it speeds up the incidents themselves, since post-mortems draw from one timeline instead of reconciling three teams’ separate exports.
Cost is the underappreciated benefit. Running five overlapping tools means paying five vendors, maintaining five sets of credentials, and training every new hire on five workflows. Consolidating around correlated, standardized telemetry cuts license overlap and, more importantly, cuts the operational tax of maintaining integrations between tools that were never designed to talk to each other.
Challenges and common pitfalls in adopting unified observability
The most common failure mode is trying to unify everything at once. Teams that attempt a full platform migration across every service simultaneously usually end up with inconsistent labeling, because different teams instrument at different speeds and nobody enforces a shared standard under deadline pressure.
Inconsistent metadata is the pitfall that undermines everything else. If one team tags env=production and another tags environment=prod, correlation breaks silently. Nobody notices until an incident, when the dashboard and the trace tool can’t be joined and engineers are back to manual searching, exactly the problem unified observability was supposed to solve.

Cardinality growth is the quiet budget killer. Adding a high-cardinality label, like a raw user ID, to every metric can multiply your time series count by orders of magnitude, and most teams only discover this when the bill arrives. Cap cardinality intentionally rather than discovering the limit the hard way.
Alert fatigue survives the migration if nobody redesigns the alerting logic. Porting old threshold-based alerts into a new platform without rethinking them just moves the noise problem to a more expensive tool. Alert on state transitions and ownership from day one, not as a later cleanup project.
Tool sprawl during transition is another trap: many teams run the old siloed stack alongside the new unified one for months “just in case,” which means paying for both while gaining the benefits of neither. Set a firm cutover date and hold to it once the pilot journey proves out.
Finally, treating observability as a pure infrastructure project instead of a cultural one stalls adoption. If SLO ownership and runbook discipline aren’t built into team norms, the platform sits underused regardless of how well it is architected.
Use cases and industry examples
A payments team running a hybrid estate, part on-premises mainframe, part Kubernetes on cloud, uses correlation IDs to trace a transaction from the on-prem authorization service through to the cloud-hosted fraud check and settlement API. Without a shared correlation ID across that boundary, a failed transaction looks like three unrelated incidents instead of one.
An e-commerce platform facing seasonal traffic spikes uses adaptive thresholds tied to historical patterns, so a Black Friday traffic surge doesn’t trigger the same alert storm a static threshold would generate on a normal Tuesday. The SLO for checkout latency stays the anchor metric regardless of traffic volume.
A multi-cluster Kubernetes environment spanning several regions uses Prometheus for local metrics collection with Thanos federating queries across clusters, so an SRE investigating a regional outage doesn’t need to log into five separate Prometheus instances to see the full picture.
A platform engineering team supporting dozens of internal services standardizes on OpenTelemetry across every new service at creation time, enforced through a shared service template. New services inherit correlation and labeling for free instead of retrofitting it after an incident exposes the gap.
A financial services firm managing strict compliance requirements uses centralized log ingestion with label-based indexing to keep audit trails searchable without paying for full-text indexing on every line, a pattern that keeps both query speed and storage cost under control at scale, illustrated in examples of scalable IT setups for growing teams.
Security and compliance considerations for telemetry data
Telemetry pipelines carry more sensitive data than most teams realize. Logs and traces routinely capture request payloads, user identifiers, and internal service topology, all of which need the same access controls as production data itself, not an afterthought bolted onto the observability stack.
Access control should scope by role. Not every engineer needs to see raw log payloads that might contain personally identifiable information; scoped access to dashboards and aggregated metrics is often sufficient for most day-to-day work, with raw log access reserved for on-call investigation.
Retention policy is a compliance question as much as a cost question. Regulated industries often have mandated minimum and maximum retention windows for audit logs, and tiered retention strategies (hot, warm, cold storage) need to respect those windows explicitly rather than being tuned purely for cost.
Data residency matters in hybrid and multi-region deployments. If telemetry from an EU-based service routes through a US-based ingestion pipeline, that can trigger data residency obligations depending on what the logs contain, a detail worth confirming with legal and compliance teams before finalizing pipeline architecture.
Redaction at the point of ingestion, not after storage, is the safer pattern. Stripping sensitive fields (tokens, credentials, personal data) in the Collector pipeline before data lands in long-term storage reduces the blast radius if that storage is ever compromised or misconfigured.
Audit logging for the observability platform itself deserves the same rigor as audit logging for production systems, especially once AI-driven suggestions or automated runbook actions are in the loop. Every automated action needs a traceable record of what was suggested, what was approved, and by whom.
Opsphere: the operational intelligence layer for unified telemetry
Building unified observability from scratch means wiring together a Collector fleet, a metrics backend, a log store, a tracing system, and an alerting pipeline, then keeping all five in sync as your infrastructure changes. Opsphere approaches the problem differently: instead of adding a sixth tool to correlate, it sits across your existing AWS, Kubernetes, CI/CD, security, and observability tooling as a single operational layer that already understands how they relate.
That correlation is where the practical value shows up. Some platforms combine alert correlation and noise reduction, causal inference, and real-time topology mapping so an engineer investigating an incident can view the dependency graph and likely root cause in one interface, rather than reconstructing it from multiple dashboards. Automated runbook generation and AI agents built on Model Context Protocol can turn the “what do I do next” question into a suggested action, with a human still in the loop before anything executes, matching the guardrail discipline that responsible AI-driven observability requires. A read-only design across many operational tools can add a correlation layer without expanding attack surface or duplicating write access already controlled elsewhere.
If tool sprawl is the problem eating your team’s time, the Opsphere platform is built specifically to reduce it. Start with the Opsphere Web Client to see how a unified operational view handles your next incident before it happens.
Sources
For deeper implementation detail, consult the Azure Well-Architected observability recommendations, the TechTarget nine-step observability strategy, and Spacelift’s observability best practices guide.
- Observability — Azure Well-Architected Framework: Operational excellence
- 11 Key Observability Best Practices You Should Know in 2026
FAQ
What are the three types of observability data?
The three core telemetry types are metrics (numeric time series), logs (event records), and traces (request paths across services). Unified observability adds a fourth signal, events, and correlates all four with shared identifiers.
What are the four pillars of observability?
Most practitioners define the four pillars as metrics, logs, traces, and events, correlated through consistent metadata like correlation IDs so engineers can pivot between them during an investigation.
What does unified observability mean in practice?
It means metrics, logs, traces, and events share consistent labels and correlation identifiers, so an engineer can move from a dashboard anomaly to the specific trace and log lines that explain it without switching context between disconnected tools.
What are commonly used observability tools?
Common building blocks include OpenTelemetry for vendor-neutral instrumentation, Prometheus-style systems for metrics collection, and label-indexed log stores like Grafana Loki. Platforms like Opsphere add a correlation and AI layer across these tools and your broader cloud and DevOps stack rather than replacing them.
How long does it take to implement unified observability?
Timelines vary by team size and existing tooling, but a single-journey pilot, instrumented with OpenTelemetry and tied to one SLO, typically takes a few weeks to stand up and validate before expanding to additional services.
Recommended
This article is provided for general informational purposes only and does not constitute professional, legal, security, or compliance advice. Please evaluate recommendations against your organization’s specific environment and requirements.