
Cut Ingest Costs: 6 Observability Pipeline Stages SREs Must Monitor
Cut Ingest Costs: 6 Observability Pipeline Stages SREs Must Monitor

An observability pipeline is a stream-processing layer that collects, enriches, filters, and routes telemetry (logs, metrics, and traces) between your sources and your tools. Instead of sending raw data straight into every backend, it cuts ingestion costs, reduces alert noise, and delivers the right data to the right destination. If you’re evaluating one, pilot a single telemetry flow first, measure the cost and noise reduction, then expand.
TL;DR:
- An observability pipeline reduces costs and noise by filtering, enriching, and routing telemetry data before it reaches storage and analysis tools.
- Scaling telemetry volume due to microservices and tool sprawl can cause bottlenecks, making a pipeline essential for managing data flow and maintaining reliability.
- Key pipeline stages include ingestion, parsing, enriching, filtering, and routing, with monitoring of lag, error rates, and backlog metrics crucial for health.
- Starting with a single pilot flow focused on high-cost or noisy data helps validate benefits before expanding the pipeline across sources.
- An operational intelligence layer enhances incident investigation by correlating telemetry with infrastructure and deployment events, reducing mean time to resolution.
Table of Contents
- Why Observability Pipelines Matter Right Now
- The Stages Every Observability Pipeline Needs
- How to Get Started: A Practical Rollout Plan
- Common Pipeline Patterns You Can Reuse
- Where an Operational Intelligence Layer Fits Alongside Your Pipeline
- Pilot Opsphere Against Your Own Pipeline Data
- Sources
- FAQ
Why Observability Pipelines Matter Right Now
Telemetry volume doesn’t grow in a straight line. A single Kubernetes cluster running a service mesh can generate more log lines in an hour than a monolith produced in a week, and most teams feel that shift long before finance does. Every new microservice, sidecar, and third-party integration adds another emitter, and most platform teams still route that data straight into expensive indexes without touching it first.
Three pressures are driving pipeline adoption:
- Telemetry growth outpaces headcount. Engineering teams add services faster than they add budget for log indexing and metric storage.
- Tool sprawl fragments context. A trace lives in one APM tool, logs sit in another, and metrics live in a third, so engineers stitch signals together by hand during incidents.
- Agent fatigue slows shipping. Every host running five or six separate collectors becomes a maintenance burden and a source of version drift.
An observability pipeline sits between your sources and your destinations and does the work that used to happen inside each individual tool: enrichment, sampling, PII redaction, and routing. Centralizing that logic means you write a redaction rule once instead of five times across five agents.
Two architecture patterns dominate current deployments. Edge collector patterns push lightweight processing (basic parsing, tagging) onto agents running near the source, then forward to a centralized tier for heavier transforms. Brokered stream patterns put a message broker, often Kafka or a managed equivalent, between collection and processing, which buys you replay capability and decouples ingestion speed from processing speed. Most production pipelines end up as a hybrid: light edge processing plus a centralized worker fleet subscribed to a broker.
The Stages Every Observability Pipeline Needs
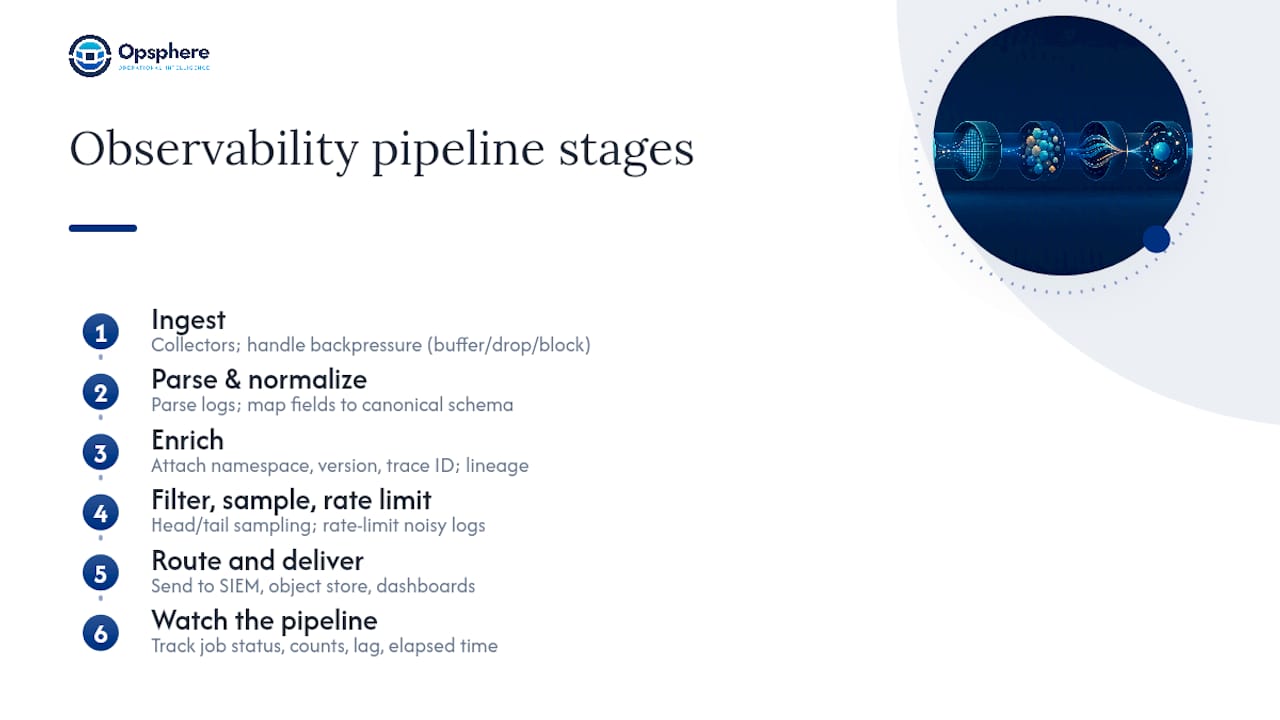
A pipeline is really a chain of six responsibilities, and each one maps to a specific engineering decision you’ll need to make before you write a single transform rule.
Ingest. Collectors, agents, and sidecars pull data from sources and hand it to the pipeline. This is where backpressure handling matters most: if your downstream processing slows down, does the collector buffer, drop, or block the application it’s attached to? Get this wrong and a slow enrichment stage can cause upstream request latency, which defeats the entire purpose of adding observability.
Parse and normalize. Raw telemetry arrives in inconsistent shapes. A pipeline should parse unstructured logs into structured fields and map source-specific field names onto a canonical schema, so svc, service_name, and app all become one field your dashboards can query consistently.
Enrich. This is where a log line gets tagged with the Kubernetes namespace it came from, the deployment version, or a trace ID linking it to a span. Gartner’s research on data observability tooling notes that modern platforms need granular, column-level lineage to support compliance audits and downstream impact analysis, and enrichment is the stage where that lineage gets attached.
Filter, sample, and rate limit. Not every log line deserves a permanent home in your index. Head sampling, tail sampling for traces, and volume-based rate limits on noisy debug logs cut ingestion volume without losing the signals that matter during an incident.
Route and deliver. A single enriched event might need to go to three places: a SIEM for security review, a cost-efficient object store for long-term retention, and a real-time dashboard for on-call visibility. Destination-specific transforms handle format differences between those sinks.
Watch the pipeline itself. The pipeline is software, and software fails. Google Cloud’s documentation for Dataflow and Apache Beam recommends tracking job status, element counts, system lag, and elapsed time as core metrics for any streaming job, and those same metrics apply directly to observability pipelines.
Pro Tip: Instrument your pipeline’s own system lag before you instrument anything else. A pipeline silently falling behind by ten minutes looks identical to a healthy one until an incident happens and your dashboards show stale data.
Design for growth from day one. Telemetry volume tends to climb steadily year over year as teams add services, so favor stateless transforms wherever the logic allows, since stateless stages scale horizontally without the coordination overhead that stateful ones require.
How to Get Started: A Practical Rollout Plan
Building an observability pipeline architecture from scratch feels like a big lift. It isn’t, if you scope the first phase tightly and resist the urge to route every telemetry source on day one.
- Pick one pilot flow. Choose a telemetry stream with a clear cost or noise problem, such as a chatty microservice’s debug logs, and define success upfront: percentage reduction in ingested bytes, MTTR change during the next incident touching that service, and dollar cost against your current bill.
- Decide edge versus centralized processing. Lightweight parsing and tagging can run at the edge; heavier enrichment, joins, and stateful aggregation belong in a centralized tier where you can scale workers independently.
- Plan for storage before you need it. Sampled and pre-aggregated data still needs somewhere to land, and your retention policy should differ by destination since a SIEM often has different retention requirements than a metrics store.
- Build in backpressure and idempotency from the start. Retries are inevitable, and a pipeline that isn’t idempotent will double count events during a broker replay or a worker restart.
- Deploy pilot, then canary, then progressive rollout. Run the pilot flow in parallel with your existing path for at least one full incident cycle before cutting over.
Once a pilot is running, monitoring becomes the real work. Track these dimensions on every pipeline stage:
- System lag and elapsed time per stage, so you know exactly where a slowdown originates.
- Job status and error rates, following the same job-level health checks Dataflow exposes for streaming jobs.
- Backlog metrics (bytes, records, and seconds behind), which Databricks documentation highlights as core streaming source metrics worth dashboarding for any pipeline with a queue or broker in front of it.
- Throughput and element counts, to catch silent drops before they become a gap in your data.
Orchestration success alone isn’t enough evidence that the pipeline is healthy. A pipeline can report a green job status while still silently dropping or corrupting data, so pair job-level checks with data-level validation on freshness, volume, and schema. On the security side, redact PII at the earliest possible stage, encrypt data in transit and at rest, and scope access controls so only the teams that need a given telemetry stream can query it.
Common Pipeline Patterns You Can Reuse
Most teams don’t need a custom architecture. They need one of five patterns, adapted to their own sources and destinations.
- Noise reduction and log sampling. Apply head sampling to high-volume debug logs while keeping 100% of error-level events, cutting ingested volume without losing incident-relevant signal.
- Cost control through pre-aggregation. Roll high-cardinality metrics into summarized buckets before they hit your metrics store, then route only the raw detail that a specific team actually queries.
- Security and SIEM routing. Normalize and enrich security-relevant events (auth logs, network flow data) before forwarding to a SIEM, so analysts get consistent field names instead of five different log formats.
- Transform once, deliver many. Enrich an event a single time, then fan it out to a dashboard tool, a long-term archive, and an analytics warehouse, each with its own format transform applied at the delivery stage.
- On-stream detection. Run lightweight rule checks or threshold alerts inside the pipeline itself, catching obvious anomalies before the data even reaches a dashboard.
Industry guidance on data observability points to five dimensions worth checking at every stage: freshness, volume, schema, distribution, and lineage. Building these checks into your routing logic, rather than bolting them on after the fact, catches most silent failures before they reach a downstream consumer.
Where an Operational Intelligence Layer Fits Alongside Your Pipeline
A well-built pipeline solves ingestion, enrichment, and routing. It doesn’t solve the harder problem: connecting a spike in one telemetry stream to a change in an entirely different system three tools away. That’s the gap an operational intelligence layer is built to close.
An operational intelligence layer can sit on top of your existing observability pipeline and correlate what it delivers against infrastructure state, deployment history, and configuration changes across your stack. Instead of an engineer manually cross-referencing a log spike against a recent Kubernetes rollout, Opsphere’s platform pulls that context together automatically.
Practical points of overlap:
- Cross-source correlation. An operational intelligence platform connects to AWS, Kubernetes, CI/CD systems, and existing observability tools, linking a pipeline-delivered alert to the deployment or config change that likely caused it.
- Causal hints, not just alerts. Rather than surfacing a noisy alert stream, an operational intelligence platform can highlight the operational events most likely tied to an anomaly your pipeline flagged.
- Faster investigation. Teams already fighting tool sprawl get one interface to query across sources instead of five open tabs during an incident.
The result is a shorter path from “the pipeline flagged something” to “here’s the root cause and the fix.”
Pilot Opsphere Against Your Own Pipeline Data
Building the pipeline is only half the job. The other half is making sense of what it delivers once an incident actually starts, and that’s where most teams still lose the most time. Opsphere connects to the telemetry your pipeline already routes and layers cross-source context on top, so an alert doesn’t arrive without the deployment history, infrastructure state, and related events that explain it.
Start small: pick the same pilot telemetry flow you used to test your pipeline, connect it to Opsphere through the web client, and measure whether MTTR drops during incidents that touch it. Platform engineering teams running this kind of pilot typically use it to validate correlation quality before rolling Opsphere out across additional sources, a path outlined on Opsphere’s platform engineering use case page. If you’re ready to see how it handles your own AWS or Kubernetes footprint, book a walkthrough through Opsphere’s platform overview.
Sources
For implementation-level detail beyond this guide, Google Cloud’s documentation on Dataflow monitoring covers job metrics and alerting policy setup directly. Databricks’ Lakehouse pipeline monitoring UI documents backlog and event-log features worth replicating in any custom dashboard. For alerting patterns on adjacent infrastructure signals like certificate expiry, Otterwatch’s guide to CI/CD monitoring is a useful companion reference.
- Best Data Observability Tools 2026 | Gartner Peer Insights
- Using Cloud Monitoring with Dataflow | Google Cloud
- Monitor Lakehouse pipelines in the Databricks UI | Databricks docs
- Top data observability tools and the five dimensions | Atlan
- Data pipeline monitoring to stop silent failures | AnomalyArmor blog
FAQ
What is an observability pipeline?
An observability pipeline is a stream-processing layer that collects logs, metrics, and traces from your sources, enriches and filters them, then routes each to the right destination, cutting ingestion cost and noise before data reaches your tools.
How much does it cost to run an observability pipeline like Datadog’s?
Pricing varies by vendor and data volume, and none of the sources reviewed here publish a fixed rate, so budget based on your own ingestion volume and request current pricing directly from the vendor you’re evaluating.
What are the four pillars of observability?
The four pillars are commonly defined as logs, metrics, traces, and events. Some data observability frameworks add a fifth dimension, lineage, when evaluating the health of a pipeline itself rather than just an application’s telemetry.
What are the best observability pipeline tools available?
There’s no single fixed top-ten list, since tool fit depends on your stack, but strong evaluation criteria include streaming metrics support (job status, system lag, backlog), lineage tracking, and routing flexibility across multiple destinations. Layering an operational intelligence platform like Opsphere on top of your pipeline adds cross-source correlation that most pipeline tools don’t handle on their own.
What metrics should I monitor on my observability pipeline?
Track system lag, job status, element counts, elapsed time, and backlog size (bytes, records, seconds) per stage, alongside error rates and throughput, so you catch both job failures and silent data-level issues.
Recommended
This article is provided for general informational purposes only and does not constitute professional, legal, security, or compliance advice. Please evaluate recommendations against your organization’s specific environment and requirements.