
Security Teams: Reduce False Positive Alerts Even at <1% FP Rate
Security Teams: Reduce False Positive Alerts Even at <1% FP Rate

A false positive alert is a benign event flagged as malicious, which NIST classifies as a type 1 error. The fastest fix is not a bigger rule library, it is measurement: capture your baseline false positive volume this week, then build a documented suppression path so analysts can dismiss confirmed false positives in seconds instead of minutes. Microsoft’s Defender for Endpoint guidance and platforms offering operational intelligence both point to the same starting move: classify before you tune.
TL;DR:
- Reducing false positives requires measuring baseline false positive volumes and building documented suppression pathways to dismiss benign alerts rapidly.
- Effective classification involves verifying event detection, collecting detailed telemetry, cross-checking detection sources, correlating signals, and documenting the verdict with supporting evidence.
- False positives often stem from overly broad rules, low-fidelity logs, environment drift, misconfigurations, or unexplainable machine learning models, leading to alert fatigue and response delays.
- Establishing key metrics such as false positive rate, triage time, and escalation percentage helps track noise reduction efforts and guides targeted rule tuning.
- Automation and explainable AI can shorten triage times by enriching alerts with context and prioritizing human review for high-confidence findings, but require careful validation to avoid blind spots.
Table of Contents
- How Do You Identify and Classify a False Positive Alert?
- What Causes False Positives, and What Do They Cost You?
- Which Metrics Actually Show You Are Reducing Noise?
- How Do You Tune Rules and Enrich Alerts Without Losing Coverage?
- Can Automation and Explainable AI Cut Triage Time?
- What Does a Sustainable Detection Lifecycle Look Like?
- Why Unified Operational Context Shortens the Triage Loop
- Reduce False Positive Alerts With Opsphere
- Sources
- FAQ
How Do You Identify and Classify a False Positive Alert?
Every SOC needs a repeatable process for deciding whether an alert deserves attention or a quick dismissal. Guessing burns time; a checklist does not.
Work through these steps in order for any ambiguous alert:
- Confirm the event fired correctly. Check that the detection logic triggered as designed, not on a parsing error or a broken field mapping.
- Collect the supporting telemetry. Pull the process tree, file hashes, parent/child relationships, logged-in user, device identity, and a timeline of the surrounding minutes.
- Cross-check the detection source. Identify whether the alert came from EDR, a SIEM correlation rule, an IDS signature, or third-party threat intelligence, since each source has different failure modes.
- Correlate with independent signals. Look for matching network flows, DNS queries, or authentication logs that either support or contradict the alert.
- Decide and document. Record the verdict, the evidence reviewed, and the analyst’s reasoning, not just “false positive” with no context.
Evidence worth capturing on every ticket includes:
- Process ancestry and command line arguments
- File and binary hashes
- User account and device posture at the time of the event
- Network flow data or Zeek-style connection logs, which Corelight notes can cut validation time from hours to minutes compared to low-fidelity log sources
- A timestamped sequence of related events
Escalate to a threat hunter or forensic analyst when the evidence is contradictory, when the asset touches sensitive data or production infrastructure, or when the same alert pattern has repeated across multiple hosts in a short window. Once classified, route the outcome to one of four actions: suppress the specific alert instance, add a scoped exclusion or allowlist entry, tune the underlying rule, or escalate for deeper investigation. Microsoft’s own workflow for Defender for Endpoint follows this same shape: identify the detection source, classify the alert, then suppress, create an indicator, or unwind any remediation the false positive triggered.
What Causes False Positives, and What Do They Cost You?
Most false positives trace back to a handful of recurring failures. Rules written too broadly catch legitimate administrative activity alongside real threats. Low-fidelity logs strip away the context an analyst needs to tell benign from malicious at a glance. Environments drift, meaning a detection tuned for last year’s architecture starts firing on this year’s normal traffic. Misconfigurations creep in during migrations or tool upgrades. And machine learning models, when left unexplained, produce verdicts analysts cannot verify quickly, so they get treated with blanket suspicion or blanket dismissal.
The operational cost compounds fast:
- Alert fatigue sets in when analysts see the same noisy pattern dozens of times a shift and start pattern matching instead of investigating.
- Burnout and turnover follow sustained high-volume triage work with little sense of impact.
- Response delays grow as queue depth increases, even for genuine incidents.
- Missed true positives happen when a real threat gets buried in noise or dismissed by an analyst numbed to repetitive false alarms.
- Trust in the tooling erodes, and teams start disabling or ignoring detections altogether, which defeats the purpose of having them.
Baseline reality check: even a sub-1% false positive rate can translate into a large daily triage burden in high-throughput environments, because the absolute count matters more than the percentage once alert volume climbs.
The goal is not zero false positives. TechTarget’s guidance on reducing false positive alerts is direct on this point: chasing zero usually means loosening detection sensitivity enough that real threats slip through. Set a tolerance level instead, one that reflects your team’s triage capacity and your organization’s actual risk appetite.
Which Metrics Actually Show You Are Reducing Noise?
You cannot fix what you have not measured. Before touching a single rule, establish a baseline across these metrics:
- False positive rate by rule or use case, so you know which detections are the worst offenders
- Daily FP volume, tracked as an absolute count, not just a percentage
- Average triage time per alert, from first view to disposition
- Mean time to dismiss (MTTDismiss) for confirmed false positives specifically
- Escalation percentage, the share of alerts that move beyond first-line triage
Tag every alert in your SIEM or EDR platform with a disposition label (true positive, false positive, benign, indeterminate) at the point of closure. That label is the raw material for both dashboards and ticketing system reports, and it is what lets a detection engineer measure whether last month’s rule change actually helped.
| Dashboard Panel | What It Tells You |
|---|---|
| FP rate trend by rule | Which detections are degrading or improving over time |
| Daily alert volume by source | Where noise concentrates (EDR vs. SIEM vs. IDS) |
| Median triage time | Whether analysts are spending too long on low-value alerts |
| Escalation rate | Whether the triage layer is filtering effectively |
| Rule change log overlay | Whether a tuning change correlates with a volume drop |
Set targets iteratively. Measure the baseline for two to four weeks, pick your worst three rules by FP volume, and set a reduction goal for each one specifically rather than a single global number. Build in a guardrail metric, typically the true positive catch rate on known test cases, so a tuning pass that quiets noise does not also blind the detection.
How Do You Tune Rules and Enrich Alerts Without Losing Coverage?
Rule tuning is where most of the durable false positive reduction happens, but it has to be done carefully enough that you are not trading noise for blind spots.
Start with these concrete rule-level changes:
- Narrow the scope. Restrict a rule to the specific process names, file paths, or network segments where the threat actually manifests, instead of matching broadly across the environment.
- Add contextual conditions. Require a second signal, like an unusual login time paired with an unfamiliar geography, rather than triggering on either alone.
- Adjust thresholds. Raise frequency or volume thresholds for detections that are only meaningful at scale, such as brute-force attempts.
- Downgrade noisy alerts to logs. If a detection has near-zero true positive value but some forensic use, convert it to a logged event instead of a page.
- Retest against known-bad samples. Before pushing a tuned rule to production, confirm it still catches your validated true positive test cases.
Exclusions, suppressions, and log-only conversions solve different problems and should not be used interchangeably. A suppression silences a specific, already-classified false positive instance, usually temporarily. An exclusion or allowlist entry removes an entire category of activity, like a known scanning tool’s IP range, from triggering at all, and it needs periodic review since the excluded entity can change behavior. Log-only conversion keeps the data for later correlation without demanding immediate analyst attention. Treat exclusions as the riskiest of the three since they create a permanent blind spot if left unmanaged.
TechTarget’s operational guidance recommends layering detection methods and enriching alerts with context before widening any exclusion. Enrichment sources worth connecting include asset inventories (is this a production database or a test sandbox?), process lineage, user role and privilege level, and a business criticality score for the affected system. A login anomaly on a developer’s laptop reads very differently than the same anomaly on a domain controller, and enrichment is what makes that distinction visible at triage time instead of after the fact.
Roll out every tuning change through a staging or canary phase before full production deployment. Run the new rule logic in parallel with the old one for a defined window, compare the alert output, and set an explicit rollback trigger, such as a spike in missed detections during validation testing.
Pro Tip: Keep a rollback script or configuration snapshot ready before you deploy any rule change. The five minutes it takes to prepare a rollback path is nothing compared to the hours lost reconstructing a rule that quietly broke detection coverage for a week.
Can Automation and Explainable AI Cut Triage Time?
Security orchestration and automated response (SOAR) platforms handle the repetitive first-pass work: pulling process telemetry, checking a hash against threat intelligence, confirming whether a flagged IP belongs to a known scanning service. A well-built SOAR playbook can enrich a low-confidence alert automatically and either close it, downgrade it, or hand it to an analyst with the context already attached, which Panther’s guidance on mitigating false positives identifies as one of the more reliable ways to cut manual triage load.
Explainable AI (XAI) adds a different layer of value on top of machine learning-driven detections. Instead of a black-box verdict, XAI methods surface feature contributions and a reliability score, so an analyst can see why a model flagged an event and how confident that flag actually is.
Reliability analysis paired with explainable AI outputs lets teams prioritize which AI-driven alerts are most likely to be errors, directing human review toward the predictions that actually need it instead of every single output the model produces.
That prioritization, drawn from research on XAI and reliability analysis for automatic false alarm detection, matters most for teams without the headcount to manually review every ML alert.
A few cautions apply before leaning heavily on automation:
- Correlate independent signals, EDR telemetry, network evidence, and threat intelligence, before escalating on a single low-confidence source.
- Watch for model drift as your environment changes; a model trained on last quarter’s traffic patterns can start misfiring on this quarter’s normal behavior.
- Never let a black-box score make the final call on a high-impact system without a human review queue in place.
What Does a Sustainable Detection Lifecycle Look Like?
Reducing false positives once does not keep them reduced. Environments change, new services get deployed, and yesterday’s tuned rule becomes tomorrow’s noise source without a maintenance process behind it.
A working detection lifecycle moves through defined stages: define the use case and threat it addresses, author the detection logic, validate it against test data and known-bad samples, deploy through staged rollout, monitor its live performance, capture analyst feedback on every false positive, and then iterate the rule or retire it if it never earns its keep.
- Assign clear ownership: a detection engineer or SOC lead should own each rule’s review cadence, not leave it ownerless after deployment.
- Maintain a false positive registry that logs every classified FP, the rule involved, and the resolution taken.
- Require documented runbooks for common alert types so triage steps do not live only in one analyst’s head.
- Set change approval criteria for any rule modification, including a rollback plan.
- Track detection health KPIs (FP rate, time-to-tune, retirement rate) at the same cadence as your incident metrics.
Why Unified Operational Context Shortens the Triage Loop
The slowest part of triage is usually not the decision, it is gathering the evidence to make one. When process data, asset ownership, network flows, and prior incident history live in five different tools, analysts spend more time pivoting between consoles than actually investigating.

Some operational intelligence platforms pull that context together in one place, using AI Agents and read-only connectors across AWS, Kubernetes, observability, and security tooling. That reduces the time-to-evidence step in the triage checklist above and feeds cleaner signal back into rule tuning, since detection engineers can see exactly which context was missing when a rule misfired.
When evaluating any platform for this purpose, check for:
- Read-only connectors across your actual stack, not just marquee integrations
- Explainability outputs, including reliability or confidence scoring on AI-driven findings
- Automation hooks that can trigger enrichment or suppression workflows directly
Pro Tip: Ask any platform you evaluate to show you a reliability score on a live alert, not a demo slide. If it cannot explain its own confidence level in real time, it will not save your analysts any triage time.
Reduce False Positive Alerts With Opsphere
Every checklist in this guide, from evidence collection to rule tuning to lifecycle governance, depends on getting the right context in front of an analyst fast. That is the gap Opsphere is built to close: instead of pivoting across AWS consoles, Kubernetes dashboards, and a SIEM to answer one triage question, teams query a single operational intelligence layer that already has the topology, dependency graph, and historical incident context assembled.

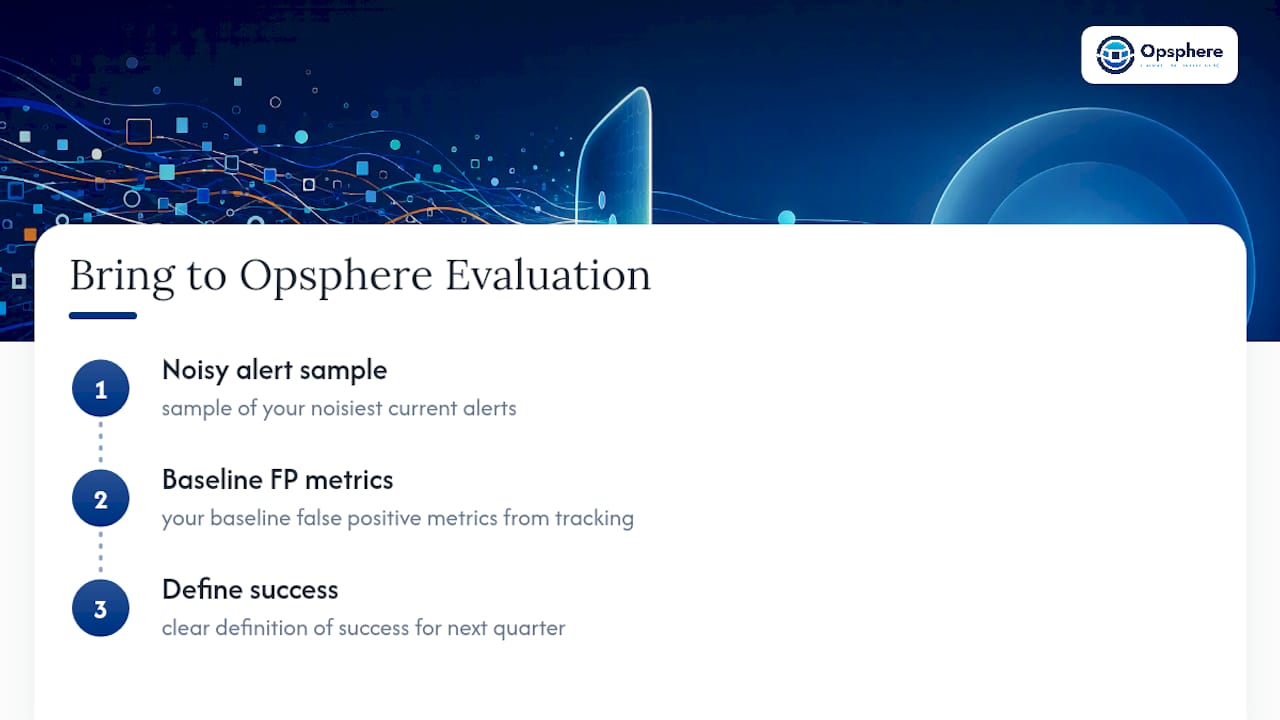
For teams running detection engineering programs, the fit is direct. Certain platforms offer correlation and noise-reduction capabilities with many read-only operational tool integrations, enabling automated enrichment steps in triage checklists, such as pulling asset criticality, process lineage, or recent deployment history. Platform engineering and SRE teams evaluating this kind of operational intelligence platform typically get the most out of a first evaluation by bringing three things: a sample of your noisiest current alerts, your baseline false positive metrics from the tracking work above, and a clear definition of what success looks like for your team in the next quarter.
If your SOC is also managing alert fatigue in adjacent operational domains, the same tuning principles apply outside of pure cybersecurity contexts, as Lokhit’s write-up on SCADA alarm fatigue shows for industrial alerting environments.
Start by exploring the Opsphere web client and requesting a walkthrough with your own noisy alert data. That is the fastest way to see whether unified context actually moves your false positive numbers, rather than just promising to.
Sources
- False Positive - Glossary
- Address false positives/negatives in Microsoft Defender for Endpoint
- How to reduce false positive alerts and increase cybersecurity
- Identifying and Mitigating False Positive Alerts
FAQ
What Are False Positive Alerts?
A false positive alert is a security event flagged as malicious that turns out to be benign, a type 1 error in NIST’s terminology. Common examples include a legitimate user login blocked as fraudulent or a safe file quarantined as malware.
What Are Some Examples of False Positives?
Typical examples include legitimate administrative scripts flagged as malware, safe software updates quarantined by endpoint protection, and non-exploitable code patterns reported as critical vulnerabilities during a scan.
What Is the Most Common Cause of a False Positive?
Overbroad detection rules are the most frequent cause, since a rule written to catch a wide pattern of behavior often catches legitimate activity that resembles it, especially without added context like user role or asset criticality.
What Can Cause Several False Positives at Once?
A batch of false positives usually points to one root cause: a broad signature update, a configuration change in a monitored environment, or a shared piece of legitimate software behaving in a way that matches multiple detection rules simultaneously. Reviewing the rule change log alongside the alert timestamps, as covered in the tracking section above, usually surfaces the common trigger quickly.
Recommended
This article is provided for general informational purposes only and does not constitute professional, legal, security, or compliance advice. Please evaluate recommendations against your organization’s specific environment and requirements.