
Save the First Hour: Blast Radius Analysis for SREs and Platform Teams
Save the First Hour: Blast Radius Analysis for SREs and Platform Teams
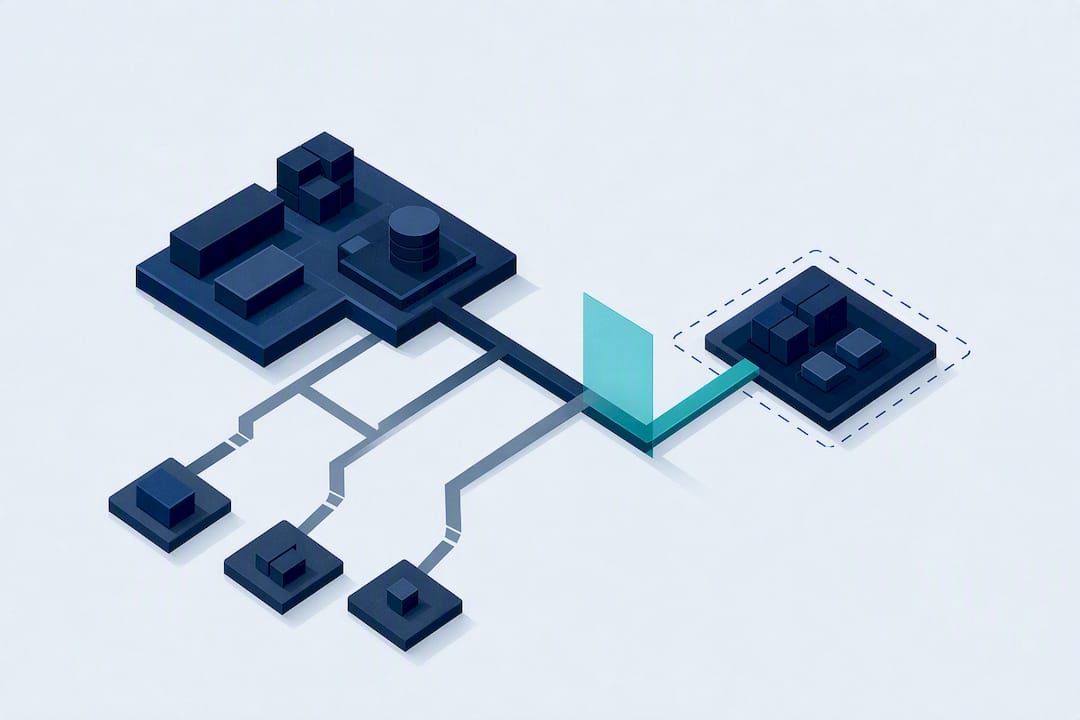
Blast radius analysis is the practice of mapping how far a technical failure, misconfiguration, or breach can propagate through your systems and the business functions that depend on them. NIST’s risk assessment framework treats this kind of impact mapping as a core input to prioritization, and the immediate action is simple: run a scan before every production deploy and attach the results to your incident playbook. Some operational platforms exist to make that scan fast enough to actually happen.
TL;DR:
- Conducts quick scans for routine deploys, detailed scans for most production changes, and full scans for migrations or security-critical updates.
- Graph traversal must include both technical dependencies and organizational impact to accurately map and score blast radius risk.
- Small permission misconfigurations, especially involving shared IAM roles, often produce the widest blast radii in practice.
- Combining technical reach with business impact criteria helps prioritize incidents more effectively than relying on technical metrics alone.
- Validating graph data, matching scan tiers to change types, and re-scanning after mitigations are key steps for reliable blast radius assessments.
Table of Contents
- What Blast Radius Analysis Covers: Technical vs. Organizational Scope
- How Is Blast Radius Measured? Graphs, Metrics, and Confidence
- Scan Types and Trade-Offs: Quick, Detailed, or Full?
- Turning Technical Blast Radius Into Business Risk Priority
- Practical Mitigations to Reduce Blast Radius
- Pre-Deploy Checks and Incident Scoping Workflow
- A perspective on unified operational intelligence
- Author José: Checklist and Practical Pointers
- See Your Blast Radius Before an Incident Forces You To
- Sources
What Blast Radius Analysis Covers: Technical vs. Organizational Scope
A blast radius scan has to answer two separate questions: what breaks technically, and who feels it organizationally. Skip either half and you get a report nobody can act on.
The technical scope traces:
- Services and workloads with direct or transitive dependencies on the changed resource
- Data stores and the records or tenants they hold
- Credentials, IAM roles, and secrets with access to the affected path
- Downstream services reachable through second and third-order dependency chains
The organizational scope layers business reality on top: which teams own the affected services, what SLAs apply, whether regulated data is in scope, and what an hour of downtime costs. A change to a shared authentication library has low technical footprint (one service) but potentially catastrophic organizational reach if every customer login depends on it. Compare that to swapping a logging library used by a single internal dashboard: technically similar in scope, organizationally trivial.
How Is Blast Radius Measured? Graphs, Metrics, and Confidence
Measuring blast radius starts with graph traversal, not guesswork. Most practical tools build a dependency graph, either from infrastructure state, code imports, or network topology, and walk it outward from the changed node.
- Build the graph. Nodes represent resources (services, databases, IAM roles); edges represent dependency, network reachability, or data flow.
- Traverse first-order neighbors. These are direct dependents. A 1-hop count tells you what breaks immediately if the node fails.
- Traverse second-order neighbors. This 2-hop expansion is where hidden risk usually lives. Open-source tools like @stackbilt/blast use breadth-first search on a reverse dependency graph to compute exactly this, surfacing “hot files” that show up in far more blast paths than expected.
- Surface the metrics that matter, including total affected resources, edge count, tenant or data record counts, jurisdictions touched, and the number of inferred (unverified) nodes.
- Flag confidence gaps. Any node the scan couldn’t verify directly, whether from missing permissions or an unmonitored source, should be marked as inferred rather than confirmed.
Statistic Callout: A single misconfigured shared IAM role can sit at the center of a dependency graph with dozens of first-order edges. That’s the mathematical reason small permission changes routinely produce the widest blast radii in practice, wider than most application deploys.
Scan Types and Trade-Offs: Quick, Detailed, or Full?
Not every change deserves the same scan. Overmind’s documentation defines three tiers with distinct runtimes and coverage, and the trade-off is speed against completeness.
- Quick scan: fast scanning suitable for routine, low-risk deploys and daily pushes.
- Detailed scan (roughly 15 minutes): the sensible default for production changes, covering first and second-order dependencies.
- Full scan (roughly 30 minutes): traverses the entire reachable graph. Reserve it for database migrations, security group changes, and compliance audits.
Map scenarios to scan type rather than debating case by case: daily application deploys get quick scans, most production changes get detailed scans, and anything touching data schemas, network boundaries, or credentials gets a full scan before merge.
Pro Tip: Set your CI pipeline to auto-escalate from quick to full scan any time a change touches an IAM policy, security group, or shared database schema. Don’t rely on engineers to remember the escalation rule under deadline pressure.
Turning Technical Blast Radius Into Business Risk Priority
A dependency graph tells you what’s reachable. It doesn’t tell you what matters most. NIST’s SP 800-30 explicitly recommends combining technical reachability with business-impact criteria rather than scoring risk on either dimension alone.
In practice, that means scoring each affected node or incident across five dimensions:
- Technical: how many systems and data paths are reachable
- Delivery: how much this disrupts release schedules or roadmap commitments
- People: how many teams get pulled into remediation
- Compliance: whether regulated data or jurisdictions are in scope
- Financial: direct cost of downtime plus SLA penalties
Plotting these scores on a heat map, similar to the MARCI-style charts used in enterprise risk practice, gives leadership a single view that separates “technically wide but low stakes” from “narrow but expensive” incidents worth escalating first.
Practical Mitigations to Reduce Blast Radius
Most blast radius reduction happens at design time, not incident time. Waiting until an outage to think about isolation is the expensive way to learn this.
Architectural controls come first: enforce least privilege on every service role, segment networks so a compromised node can’t reach unrelated systems, and draw service boundaries that limit how far a single failure can travel. Deployment practices matter just as much.
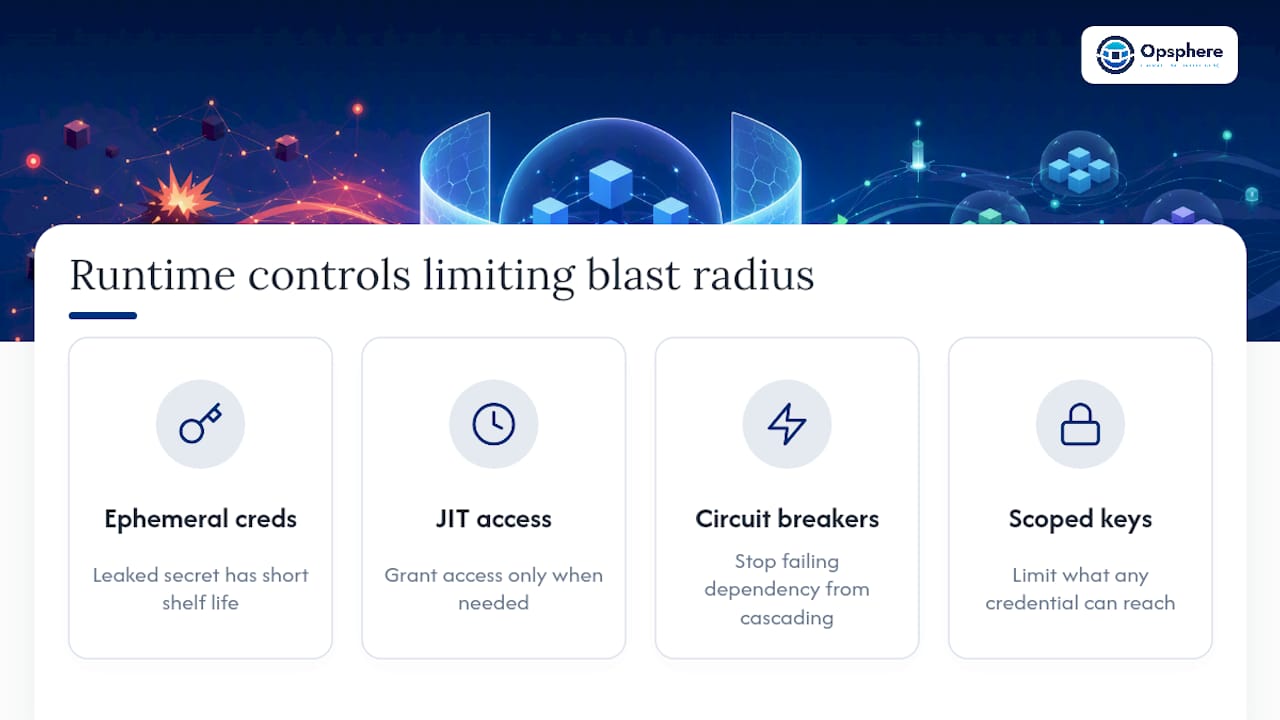
Runtime controls close the loop. Ephemeral credentials and just-in-time access mean a leaked secret has a short shelf life. Circuit breakers stop a failing dependency from cascading into services that call it. Scoped API keys limit what any single credential can reach if it’s ever compromised.
Pro Tip: Treat blast radius as a design constraint, not a post-incident metric. If a proposed architecture change increases blast radius, that’s a design review flag, the same way a security team would flag a new open port.
Pre-Deploy Checks and Incident Scoping Workflow
Blast radius analysis earns its value in two moments: right before you ship, and right after something breaks.
- Pre-deploy: run the appropriate scan tier, compare results against your defined thresholds, attach a rollback plan or runbook to any change exceeding them, and gate the deployment on that comparison.
- Incident scoping: run forward and backward lineage from the point of failure, quantify affected records, tenants, and jurisdictions, and prepare a short executive summary within the first assessment window.
- Timing: impact-assessment guidance for physical emergencies maps surprisingly well here, recommending a wide initial assessment within about 8 hours, a rapid follow-up within 48 hours, and detailed specialist review after that. Applied to incident response, that translates to: scope fast, confirm within two days, then do the forensic deep dive.
A perspective on unified operational intelligence
Blast radius scans are only as good as the graph feeding them, and most graphs are incomplete because the data lives across a dozen disconnected tools. Read-only context from cloud, Kubernetes, CI/CD, and observability tools can be pulled into a unified operational layer, which can shrink the number of inferred nodes a scan has to guess at.
That matters because the Blast Radius Analyzer approach of pairing graph traversal with organizational impact mapping only works when both data sources are current. Teams should expect three concrete outputs from any serious analysis: a dependency graph, a risk scorecard across both technical and business dimensions, and confidence notes marking what still needs verification.
Author José: Checklist and Practical Pointers
Run this before you trust a blast radius result:
- Confirm the graph includes IAM and network edges, not just service calls.
- Check the inferred node count. High inference means low confidence.
- Verify tenant and jurisdiction counts against your compliance list.
- Compare 1-hop and 2-hop counts. A big jump between them signals hidden coupling.
- Match scan tier to change type, don’t default to quick for convenience.
- Attach a rollback plan to anything exceeding your blast radius threshold.
- Score across all five risk dimensions, not just technical reach.
- Re-scan after mitigation, not just before deploy.
Accept risk only when the blast radius is genuinely narrow and the cost of mitigation exceeds the exposure. Everything else gets mitigated first, asked questions later.
— José
See Your Blast Radius Before an Incident Forces You To
Opsphere gives teams the one thing most blast radius tooling can’t: a single, current graph across cloud, Kubernetes, CI/CD, and observability data instead of five disconnected dashboards that each know part of the story. That means fewer inferred nodes, faster confidence in a scan’s results, and a real head start when you’re scoping an incident under pressure.
If you’re running detailed or full scans manually today and losing the first hour of every incident just gathering context, the Opsphere Web Client gives platform and SRE teams a unified view for exactly this workflow. Teams managing infrastructure across Terraform or running lean SRE rotations can start by connecting their existing tools and running a live scan against production, no migration required.
Sources
For deeper technical grounding, start with NIST SP 800-30 on risk assessment methodology and the Overmind documentation on scan types. For hands-on implementation, review the Blast Radius Analyzer project and the @stackbilt/blast package for graph-based traversal in code.
- Understanding Blast Radius | Overmind Documentation
- Impact assessments director’s guideline (DGL 22/20)
- Blast Radius Analyzer (GitHub)
- @stackbilt/blast (npm)